In this article we are going to cover Install Prometheus and Grafana on Ubuntu 20.04 LTS with Node Exporter and WMI Exporter | Windows and Linux Server Monitoring using Prometheus and Grafana
Table of Contents
What is prometheus?
- Prometheus is a open source Linux Server Monitoring tool mainly used for metrics monitoring, event monitoring, alert management, etc.
- Prometheus has changed the way of monitoring systems and that is why it has become the Top-Level project of Cloud Native Computing Foundation (CNCF).
- Prometheus uses a powerful query language i.e. “PromQL”.
- In Prometheus tabs are on and handles hundreds of services and micro services.
- Prometheus use multiple modes used for graphing and dashboarding support.
Why we used prometheus?
- A multi-dimensional data model with time series data identified by metric name and key/value pairs
- PromQL, a flexible query language to leverage this dimensionality
- Pushing time series is supported via an intermediary gateway
- Multiple modes of graphing and dashboarding support
Prometheus Architecture
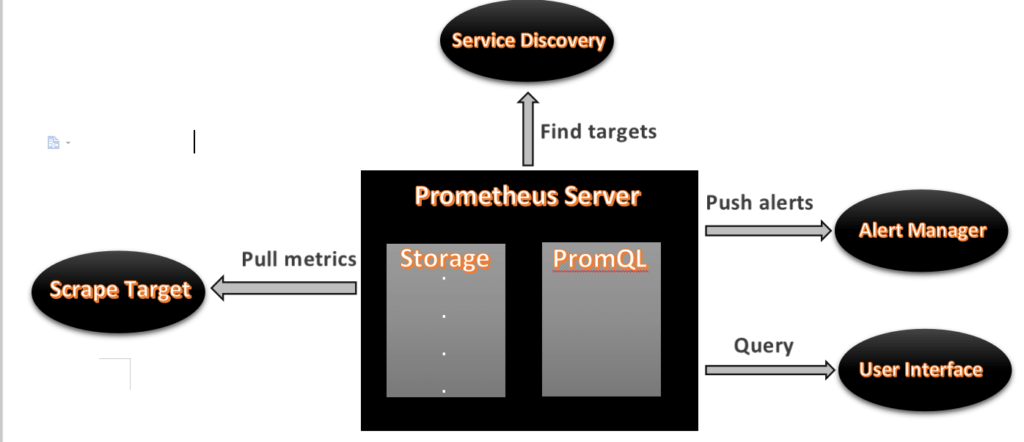
- As above we can see an architecture of Prometheus monitoring tool.
- We made a basic design to understand it easily for you people.
Now lets understand the Prometheus components one-by-one
Prometheus Components
1. Prometheus Server
- Prometheus server is a first component of Prometheus architecture.
- Prometheus server is a core of Prometheus architecture which is divided into several parts like Storage, PromQL, HTTP server, etc.
- In Prometheus server data is scraped from the target nodes and then stored in the database.
1.a. Storage
- Storage in Prometheus server has a local on disk storage.
- Prometheus has many interfaces that allow integrating with remote storage systems.
1.b. PromQL
- Prometheus uses its own query language i.e. PromQL which is a very powerful querying language.
- PromQL allows the user to select and aggregate the data.
2. Service Discovery
- Next and very important component of Prometheus Server is the Service Discovery.
- With the help of Service discovery the services are identified which need to be scraped.
- To Pull metrics, identification of services and finding the targets are compulsory needed.
- Through Service discovery we monitor the entities and can also locate its targets.
3. Scrape Target
- Once the services are identified and the targets are ready then we can pull metrics from it and can scrape the target.
- We can export the data of the end point using node exporters.
- Once the metrics or other data is pulled, Prometheus stores it in a local storage.
4. Alert Manager
- Alert Manager handles the alerts which may occurs during the session.
- Alert manager handles all the alerts which are sent by the Prometheus server.
- Alert manager is one of the very useful components of the Prometheus tool.
- If in case any big error or any issue occurs, alert manager manage those alerts and contact with human via E-mail, Text Messages, On-call, or any other chat application service.
5. User Interface
- User interface is also an important component as it builds a bridge between the user and the system.
- In Prometheus, user interfaces are note that much user friendly and can be used till graph queries.
- For good exclusive dashboards Prometheus works together with Grafana (visualization tool).
- Using Grafana over Prometheus to visualize properly we can use custom dashboards.
- Grafana dashboards display via pie charts, line charts, tables, good data graphs of CPU usage, RAM utilization, network load, etc with indicators.
- Grafana supports and run with Prometheus by querying language i.e. PromQL.
- To fetch data from Prometheus and to display the results on Grafana dashboards PromQL is used.
What is Grafana ?
- Grafana is a free and open source visualization tool mostly used with Prometheus to which monitor metrics.
- Grafana provides various dashboards, charts, graphs, alerts for the particular data source.
- Grafana allows us to query, visualize, explore metrics and set alerts for the data source which can be a system, server, nodes, cluster, etc.
- We can also create our own dynamic dashboard for visualization and monitoring.
- We can save the dashboard and can even share with our team members which is one of the main advantage of Grafana.
What is Node Exporter ?
- Node exporter is one of the Prometheus exporters which is used to expose servers or system OS metrics.
- With the help of Node exporter we can expose various resources of the system like RAM, CPU utilization, Memory Utilization, disk space.
- Node exporter runs as a system service which gathers the metrics of your system and that gathered metrics is displayed with the help of Grafana visualization tool.
What is WMI Exporter?
- It is same like Node Exporter but Node Exporter for Linux and WMI Exporter for Windows
- WMI Exporter is an exporter utilized for windows servers to collects metrics like CPU usage, memory, and Disk usage.
- It is open-source which can be installed on Windows servers using the .msi installer
Prerequisite:
Good internet connectivity
Security Groups Configured properly
Any web Browser
Security Groups Configured on EC2 Instances:
Port 9090 — Prometheus Server
Port 9100 — Prometheus Node Exporter
Port 9182—-WMI Exporter
Port 3000 — Grafana
We will update the system repository index by using the following command.
sudo apt update -yswitch to root user
sudo su -
#1. Creating Prometheus System Users and Directory
We will have to create a Prometheus user named Prometheus and a Prometheus directory named as Prometheus.
Using below commands we can create a user and directory.
sudo useradd --no-create-home --shell /bin/false prometheus
sudo useradd --no-create-home --shell /bin/false node_exporter
sudo mkdir /etc/prometheus
sudo mkdir /var/lib/prometheus
#2. Update Prometheus user
As user groups and directories are created successfully which store the Prometheus data and files.
Now we will have to update the group and user ownership on the newly created directories.
By using the below command we update the ownership.
sudo chown prometheus:prometheus /var/lib/prometheus
#3. Download Prometheus Binary File on Ubuntu
Now we will download the latest version of Prometheus. We can copy the download link as per our Operating System from Prometheus download page
Using the below command we can download Prometheus, here we are downloading Prometheus 2.31.1 version, you use the above link to download specific version.
Navigate to /tmp directory
cd /tmp/
Download the Prometheus setup using wget
wget https://github.com/prometheus/prometheus/releases/download/v2.31.1/prometheus-2.31.1.linux-amd64.tar.gz
Now we have successfully downloaded the Prometheus file and now we will extract that file.
#4. Install Prometheus and Grafana on Ubuntu 20.04 LTS
Extract the files using tar command :
tar -xvf prometheus-2.31.1.linux-amd64.tar.gz
#5. Move the configuration file and set the owner to the prometheus user:
cd prometheus-2.31.1.linux-amd64
sudo mv console* /etc/prometheus
sudo mv prometheus.yml /etc/prometheus
sudo chown -R prometheus:prometheus /etc/prometheus
#6. Update Prometheus user ownership on Binaries
Now we will update the user and group ownership on the binaries of Prometheus.
Using following commands we will update the user and group ownership.
sudo mv prometheus /usr/local/bin/
sudo chown prometheus:prometheus /usr/local/bin/prometheus
#7. Check Prometheus Version
Now the Prometheus is successfully installed on our system. We will check the version of Prometheus and to configure it.
Follow the commands to verify prometheus version.
prometheus --version

#8. Prometheus configuration file
We have already copied /tmp/prometheus-2.31.1.linux-amd64/prometheus.yml file /etc/prometheus directory, verify if it present and should look like below and modify it as per your requirement.
sudo nano /etc/prometheus/prometheus.yml
# my global config
global:
  scrape_interval: 15s # Set the scrape interval to every 15 seconds. Default is every 1 minute.
  evaluation_interval: 15s # Evaluate rules every 15 seconds. The default is every 1 minute.
  # scrape_timeout is set to the global default (10s).

# Alertmanager configuration
alerting:
  alertmanagers:
    - static_configs:
        - targets:
          # - alertmanager:9093

# Load rules once and periodically evaluate them according to the global 'evaluation_interval'.
rule_files:
  # - "first_rules.yml"
  # - "second_rules.yml"

# A scrape configuration containing exactly one endpoint to scrape:
# Here it's Prometheus itself.
scrape_configs:
  # The job name is added as a label `job=<job_name>` to any timeseries scraped from this config.
  - job_name: "prometheus"

    # metrics_path defaults to '/metrics'
    # scheme defaults to 'http'.

    static_configs:
      - targets: ["localhost:9090"]
#9. Creating Prometheus Systemd file
Now we will create a system service file in /etc/systemd/system location.
sudo nano /etc/systemd/system/prometheus.service
After creating file successfully, copy the below files and it to the newly created file. /etc/systemd/system/prometheus.service
[Unit]
Description=Prometheus
Wants=network-online.target
After=network-online.target

[Service]
User=prometheus
Group=prometheus
Type=simple
ExecStart=/usr/local/bin/prometheus \
    --config.file /etc/prometheus/prometheus.yml \
    --storage.tsdb.path /var/lib/prometheus/ \
    --web.console.templates=/etc/prometheus/consoles \
    --web.console.libraries=/etc/prometheus/console_libraries

[Install]
WantedBy=multi-user.target
After adding the program save the file with Ctrl+O and exit with Ctrl+X.
To use the newly created service we will have to reload the daemon services, Use the below command to reload daemon services.
sudo systemctl daemon-reload
start and enable prometheus service using below commands
sudo systemctl start prometheus
sudo systemctl enable prometheus
We will check the Prometheus status weather it is running or not
sudo systemctl status prometheus
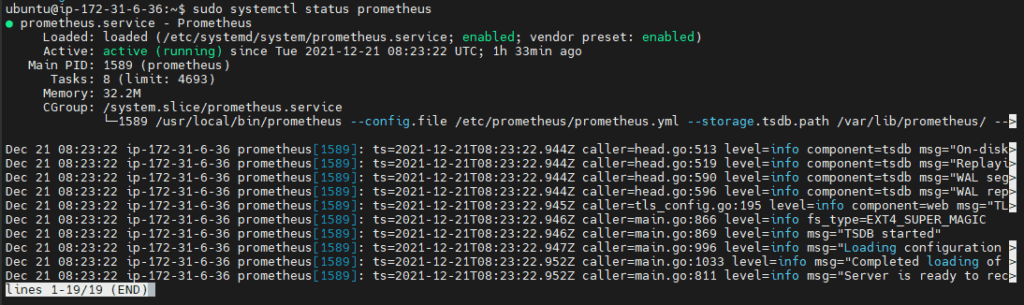
Prometheus installation and configuration is set up, We can see status Active: active(running)
#10. Accessing Prometheus on Browser
Now as Prometheus installation and configuration is set up and it is ready to use we can access its services via web interface.Also check weather port 9090 is UP in firewall.
Use below command to enable prometheus service in firewall
sudo ufw allow 9090/tcp
Now Prometheus service is ready to run and we can access it from any web browser.
http://server-IP-or-Hostname:9090.
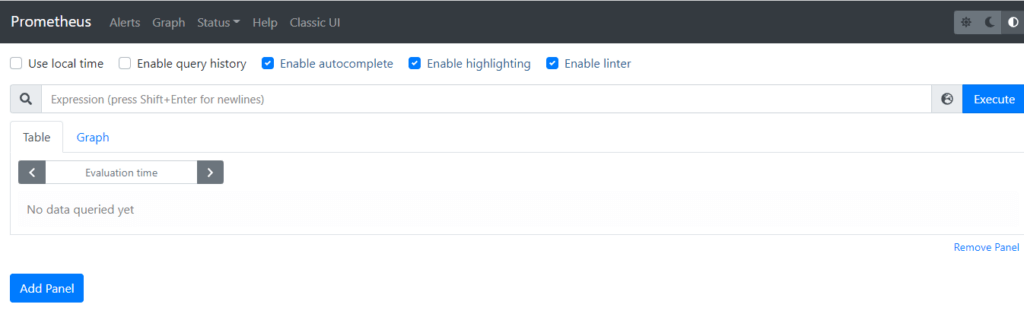
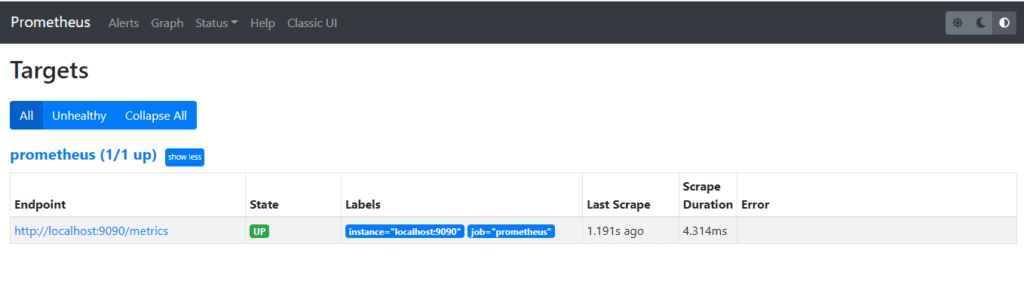
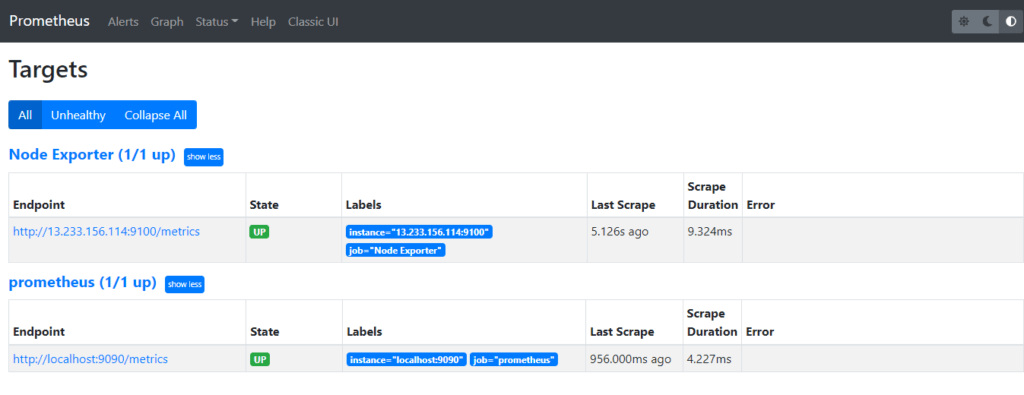
As we can see the Prometheus dashboards, we can also check the target.As we can observe Current state is UP and we can also see the last scrape.
#11. Install Grafana on Ubuntu
Download the Grafana GPG key with wget, then pipe the output to apt-key. This will add the key to your APT installation’s list of trusted keys, which will allow you to download and verify the GPG-signed Grafana package:
wget -q -O - https://packages.grafana.com/gpg.key | sudo apt-key add -
In this command, the option -q turns off the status update message for wget, and -O outputs the file that you downloaded to the terminal. These two options ensure that only the contents of the downloaded file are pipelined to apt-key.
Next, add the Grafana repository to your APT sources:
sudo add-apt-repository "deb https://packages.grafana.com/oss/deb stable main"
Refresh your APT cache to update your package lists:
sudo apt update
You can now proceed with the installation:
sudo apt install grafana
Once Grafana is installed, use systemctl to start the Grafana server:
sudo systemctl start grafana-server
Next, verify that Grafana is running by checking the service’s status:
sudo systemctl status grafana-server
You will receive output similar to this:
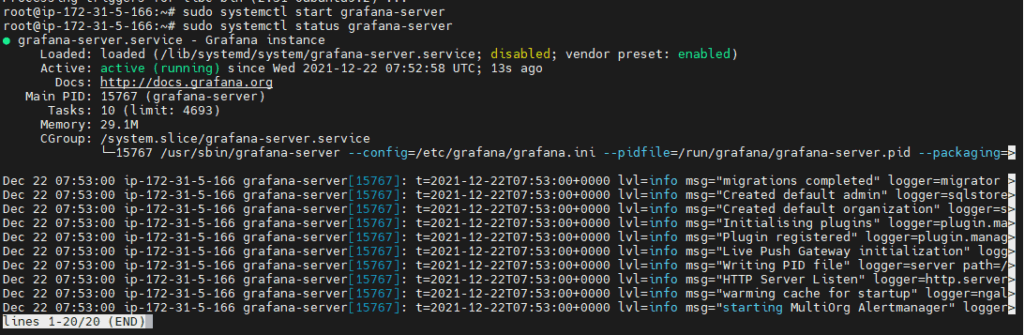
Now finally enable the Grafana service which will automatically start the Grafana on boot
sudo systemctl enable grafana-server.service
To access Grafana Dashboard open your favorite browser, type server IP or Name followed by grafana default port 3000.
http://your_ip:3000
Here you can see Login page of Grafana now you will have to login with below Grafana default UserName and Password.
Username – admin
Password – admin
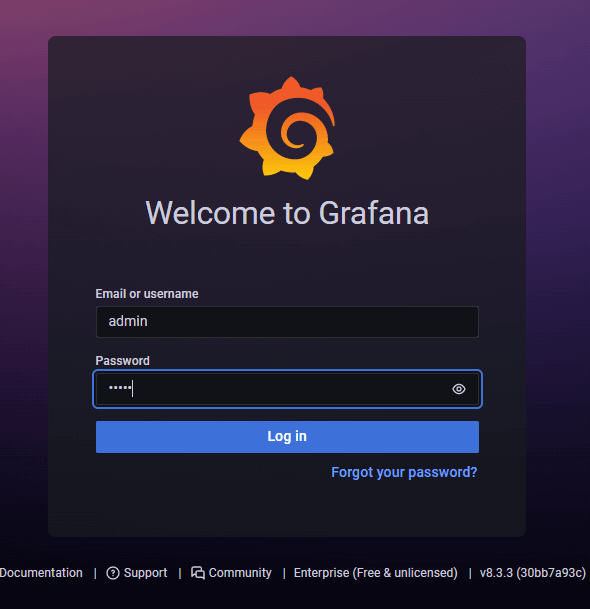
It is always a good practice to change your login credentials.
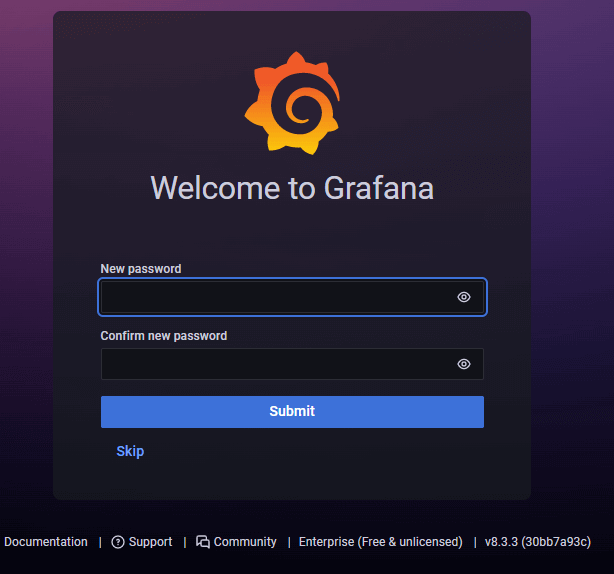
Provide your New Password and click on Change Password
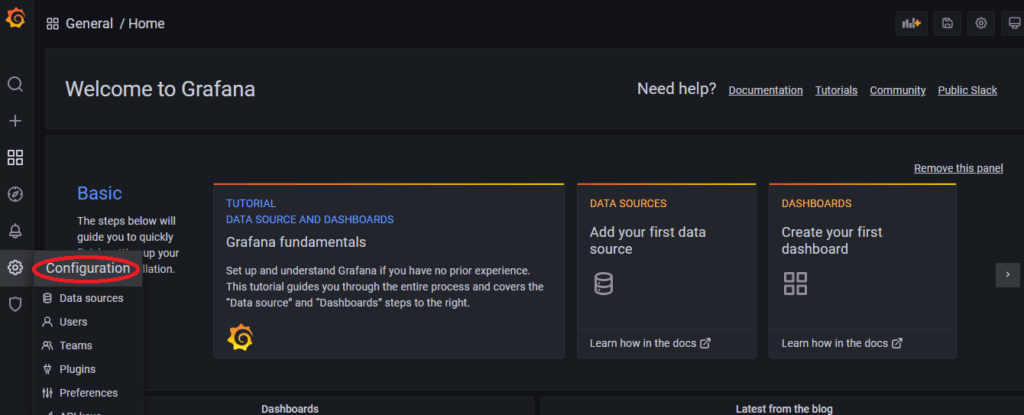
Now here you can see Home Dashboard page of Grafana

#12. Configure Prometheus as Grafana Data Source
Once you logged into Grafana Now first Navigate to Settings Icon ->> Configuration ->> data sources
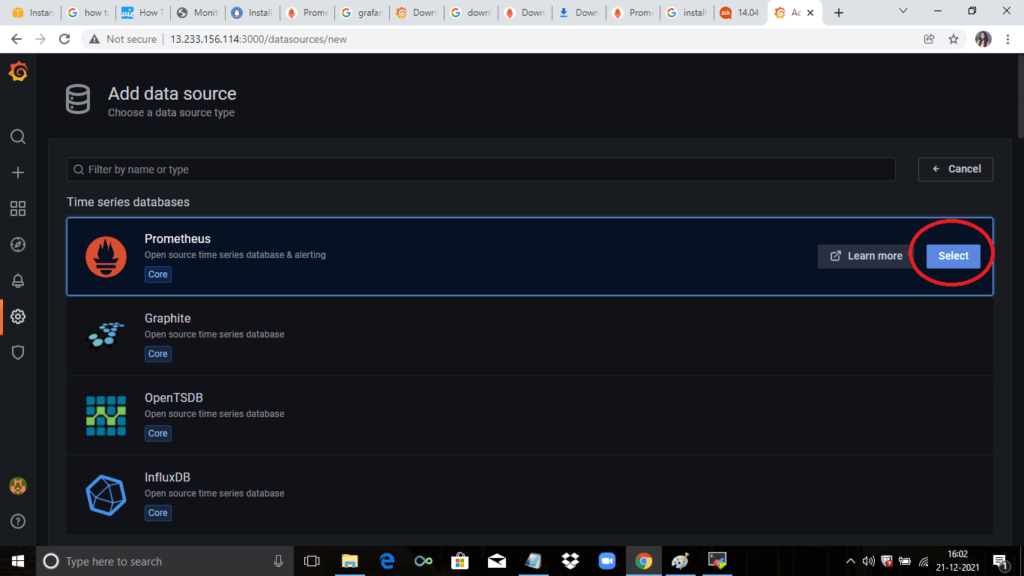
Now lets click on Add Data sources and select Prometheus
Now configure Prometheus data source by providing Prometheus URL
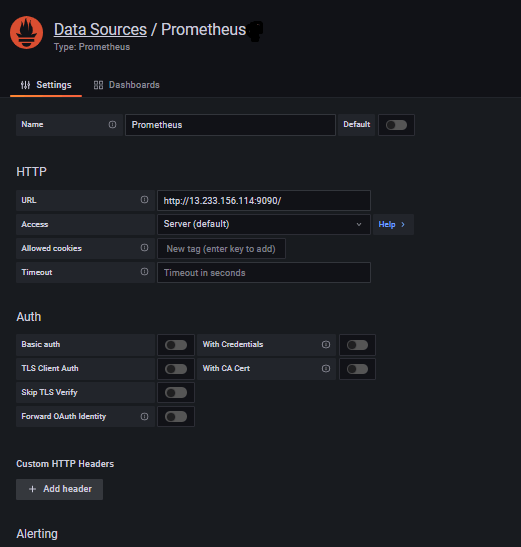
As per your requirement you can do other changes or you can also keep remaining configuration as default.
Now click on Save & test so it will prompt a message Data Source is working.

#13. Install Node Exporter on Ubuntu 20.04 LTS
Node Exporter collects the metrics of your system such as Memory usage, CPU usage, RAM, disk space, etc.
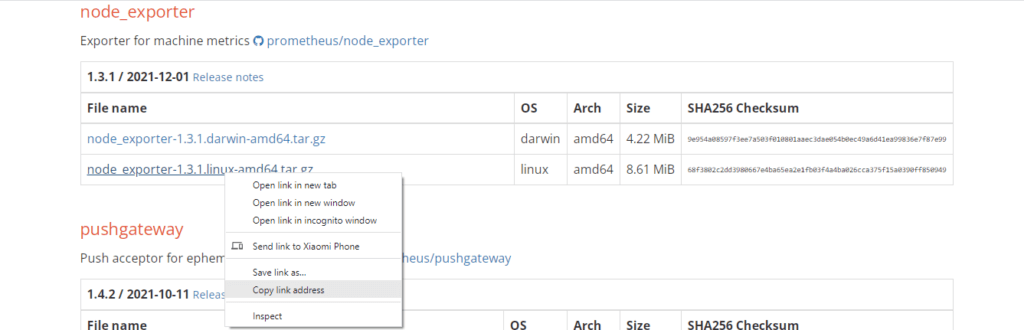
To install Node Exporter first navigate to Prometheus official download page, Scroll down and you will get node_exporter section and then select Linux OS for amd64.
Now right click on node exporter and copy link address
Now lets run the copied URL with wget command
cd /tmp
wget https://github.com/prometheus/node_exporter/releases/download/v0.18.1/node_exporter-0.18.1.linux-amd64.tar.g
Unzip the downloaded the file using below command
tar xvfz node_exporter-*.*-amd64.tar.gz
Move the binary file of node exporter to /usr/local/bin location.
sudo mv node_exporter-*.*-amd64/node_exporter /usr/local/bin/
Create a node_exporter user to run the node exporter service.
sudo useradd -rs /bin/false node_exporter
#14. Create a node_exporter service file in the /etc/systemd/system directory
sudo nano /etc/systemd/system/node_exporter.service
Paste the below content in your service file
[Unit]
Description=Node Exporter
After=network.target
[Service]
User=node_exporter
Group=node_exporter
Type=simple
ExecStart=/usr/local/bin/node_exporter
[Install]
WantedBy=multi-user.target
Now lets start and enable the node_exporter service using below commands
sudo systemctl daemon-reload
sudo systemctl enable node_exporter
sudo systemctl start node_exporter
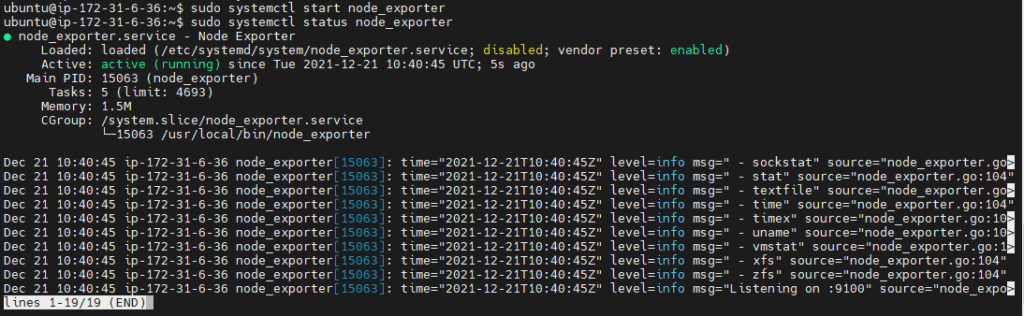
sudo systemctl status node_exporter
We have covered How to Install Prometheus and Grafana on Ubuntu 20.04 LTS with Node Exporter.
#15. Configure the Node Exporter as a Prometheus target
Now to scrape the node_exporter lets instruct the Prometheus by making a minor change in prometheus.yml file
sudo nano /etc/prometheus/prometheus.yml
-job_name: 'Node_Exporter'

    scrape_interval: 5s

    static_configs:

      - targets: ['<Server_IP_of_Node_Exporter_Machine>:9100']
After changing in config file you need to restart to prometheus
Now restart the Prometheus Service
sudo systemctl restart prometheus
Hit the URL in your web browser to check weather our target is successfully scraped by Prometheus or not
https://localhost:9100/targets
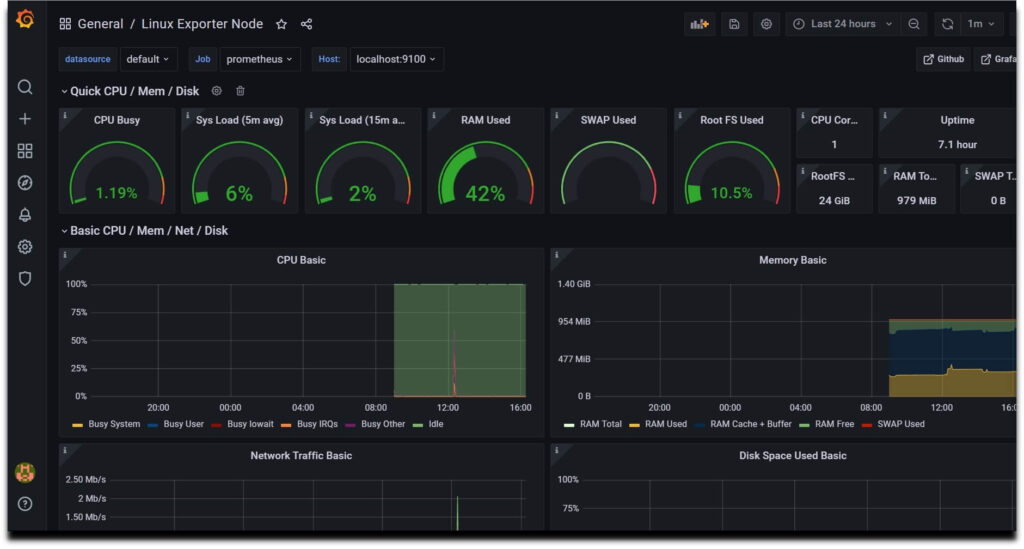
#16. Creating Grafana Dashboard to Monitor Linux Server
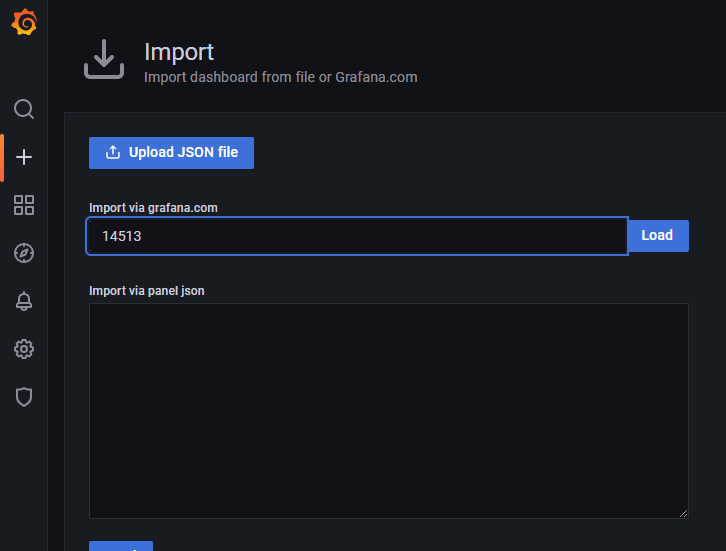
Now lets build a dashboard in Grafana so then it will able to reflect the metrics of the Linux system.So we will use 14513 to import Grafana.com, Lets come to Grafana Home page and you can see a “+” icon. Click on that and select “Import”

Now provide the Grafana.com Dashboard ID which is 14513 and click on Load
Now provide the name and select the Prometheus Datasource and click on Import.
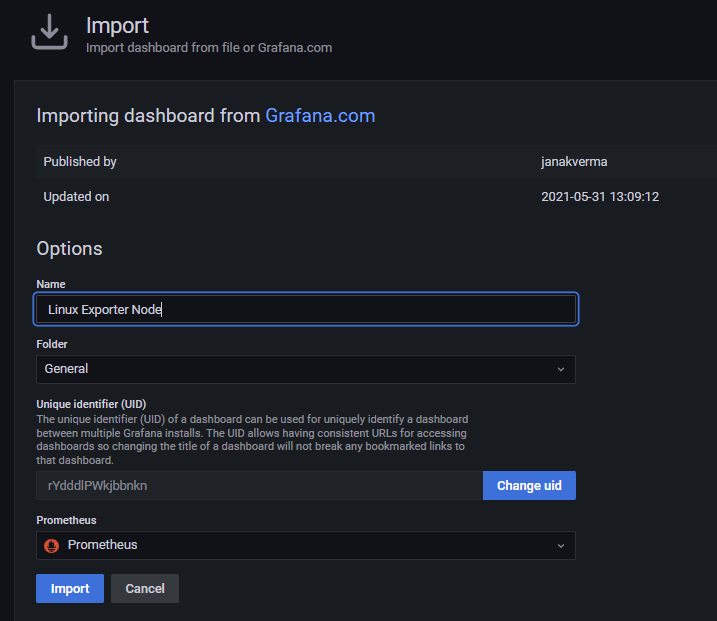
There you are done with the setup. Now your Dashboard is running up!.
#17. Install WMI Exporter on Windows
For Windows hosts, you are going to use the Windows exporter.
You can download the latest version of windows installer from here
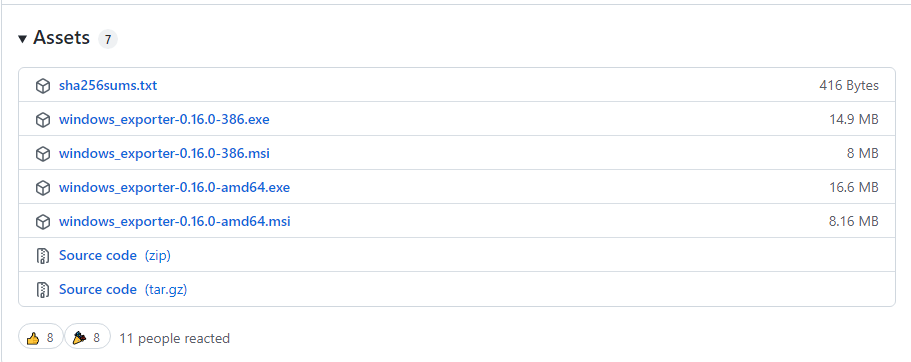
When the download is done, simply click on the MSI file and start running the installer.
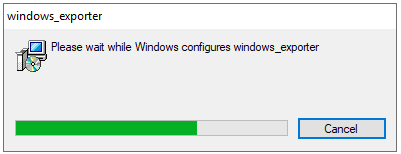
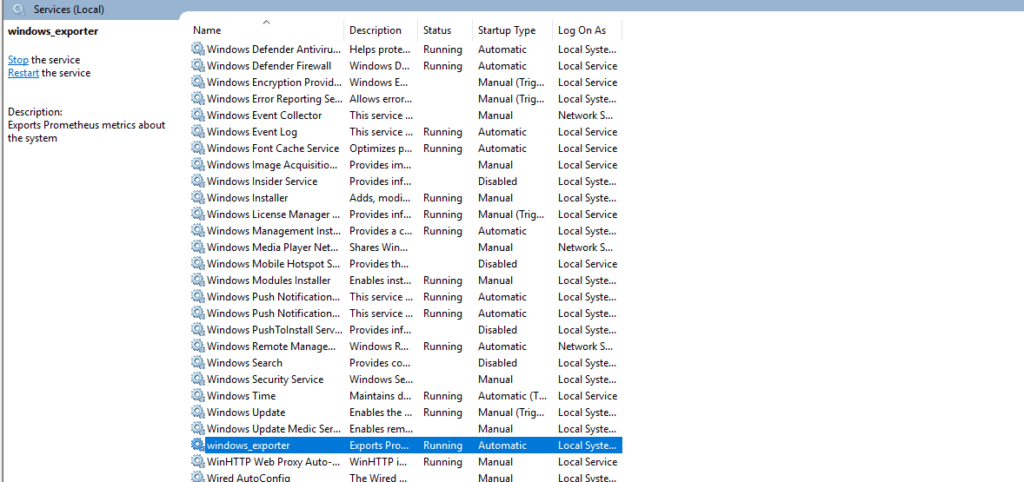
After Installation of WMI Exporter lets check its sucessfully installed or not
So go to services and search windows exporter.
Make sure windows exporter service is running.
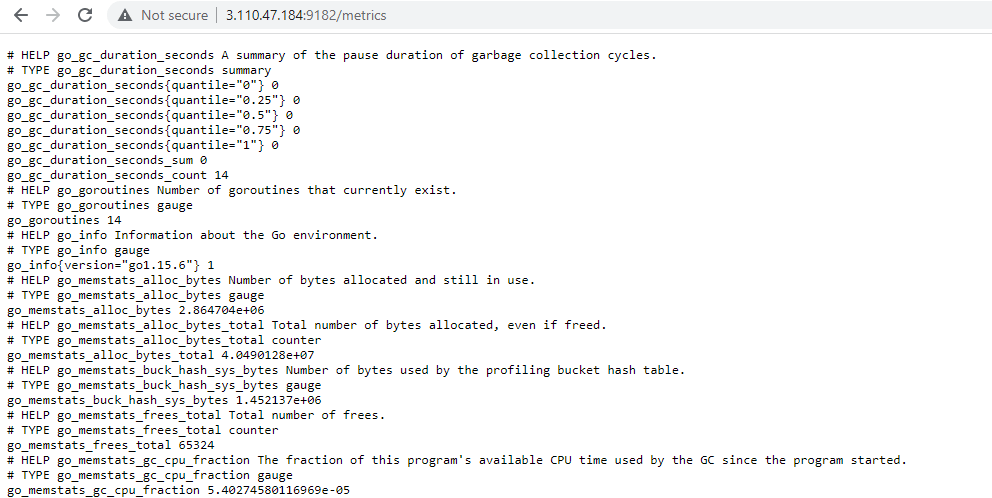
Now that your exporter is running, it should start exposing metrics on
http://localhost:9182/metrics
So let’s check
#18. Configure the WMI Exporter as a Prometheus Target
Now run the below command to update config file
sudo nano /etc/prometheus/prometheus.yml
Update config file with below code:
 - job_name: "WMI Exporter"

    # metrics_path defaults to '/metrics'
    # scheme defaults to 'http'.

    static_configs:
      - targets: ["Host_ip:9182"]
Now save the file nd exit
After changing in config file you need to restart prometheus server with below commands:
sudo systemctl restart prometheus
sudo systemctl status prometheus
Hit the URL in your web browser to check weather our target is successfully scraped by Prometheus or not
https://localhost:9182/targets

#19. Creating Grafana Dashboard to monitor Windows server
Now lets build a dashboard in Grafana so then it will able to reflect the metrics of the Windows system.
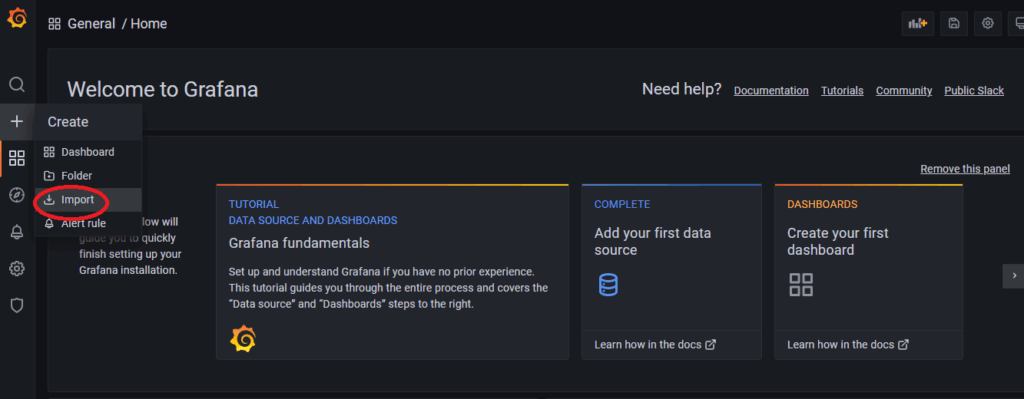
So we will use 14510 to import Grafana.com, Lets come to Grafana Home page and you can see a “+” icon. Click on that and select “Import”
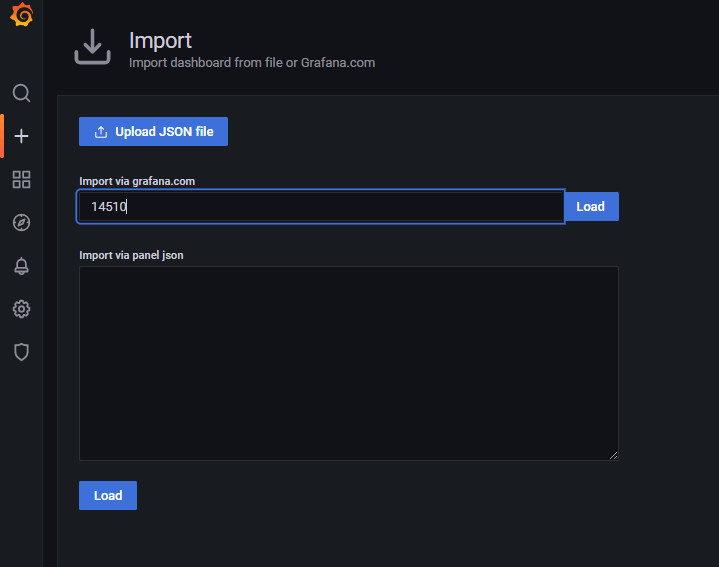
On the next window, simply enter the dashboard ID in the corresponding field
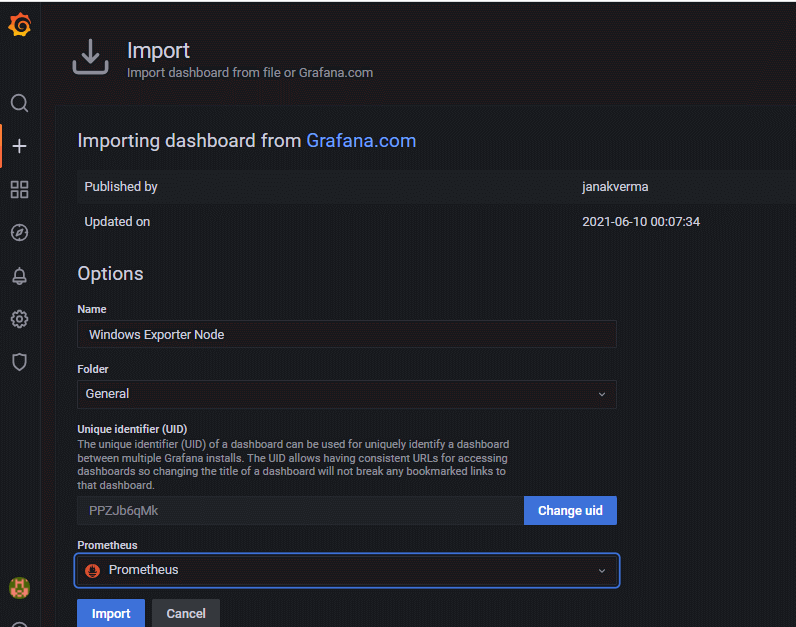
Now provide the name and select the Prometheus Datasource and click on Import.
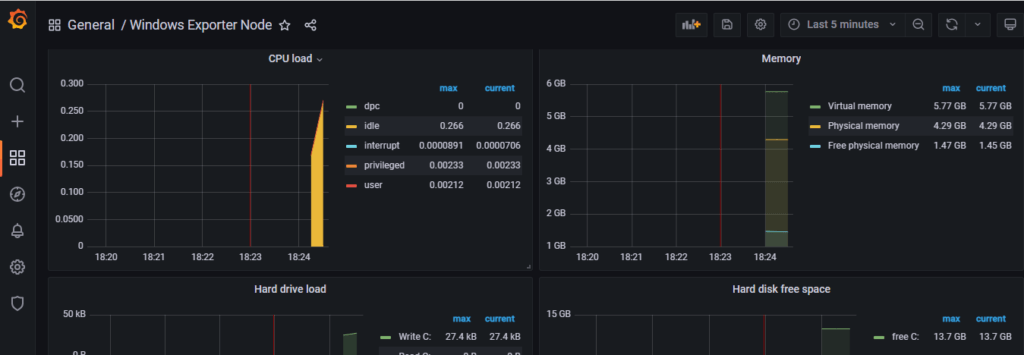
There you are done with the setup. Now your Dashboard is running up!
Conclusion:
In this article we have covered Install Prometheus and Grafana on Ubuntu 20.04 LTS with Node Exporter and WMI Exporter | Windows and Linux Server Monitoring using Prometheus and Grafana.
Related Articles:
Kubernetes cluster Monitoring with Prometheus and Grafana
Reference:
Hi.
I would like to say thanks for this great tutorial.
I would like to ask if it would be possible to monitor both Linux (Node Exporter) and Windows (WMI Exporter) using only 1 dashboard.
I have tried it, but i failed. I have a windows server and a linux server. I have inserted the windows server IP address under the “Node exporter” scrape job in the “prometheus.yml” file. On prometheus, I can see that the windows server is detected and status is “UP.” However on the grafana dashboard, i can’t see the windows ip under the “instance name”
Hope you could help.
Thank you
Wow, what a really nice and detailed article, bravo !
Everything is rolling as expected but to go further, I’d like to create a dashboard with an overview of all servers including linux and windows servers to see if they are up or down and have a quick view of their specs to see which one is going too high.
Thanks anyway for your present article,
Have a great day