In this article we are going to cover What is Prometheus, Why to use Prometheus, Prometheus Architecture,Prometheus Components,How to Install Prometheus on Amazon Linux 2.
Table of Contents
What is Prometheus?
- Prometheus is a open source Linux Server Monitoring tool mainly used for metrics monitoring, event monitoring, alert management, etc.
- Prometheus has changed the way of monitoring systems and that is why it has become the Top-Level project of Cloud Native Computing Foundation (CNCF).
- Prometheus uses a powerful query language i.e. “PromQL”.
- In Prometheus tabs are on and handles hundreds of services and microservices.
- Prometheus use multiple modes used for graphing and dashboarding support.
Why to use Prometheus?
- A multi-dimensional data model with time series data identified by metric name and key/value pairs
- PromQL, a flexible query language to leverage this dimensionality
- Pushing time series is supported via an intermediary gateway
- Multiple modes of graphing and dashboarding support
Prometheus Architecture
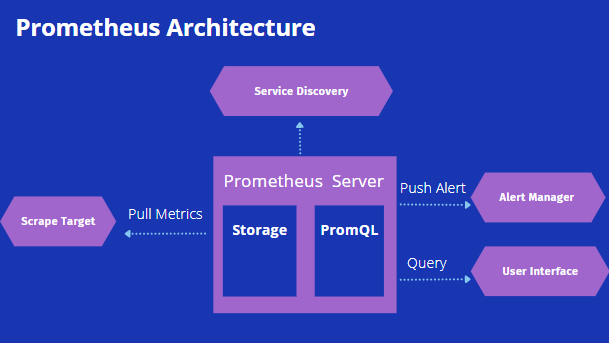
As above we can see an architecture of Prometheus monitoring tool.
We made a basic design to understand it easily for you people.
Now lets understand the Prometheus components one-by-one
Prometheus Components
1. Prometheus Server
- Prometheus server is a first component of Prometheus architecture.
- Prometheus server is a core of Prometheus architecture which is divided into several parts like Storage, PromQL, HTTP server, etc.
- In Prometheus server data is scraped from the target nodes and then stored in the database.
1.a. Storage
- Storage in Prometheus server has a local on disk storage.
- Prometheus has many interfaces that allow integrating with remote storage systems.
1.b. PromQL
- Prometheus uses its own query language i.e. PromQL which is a very powerful querying language.
- PromQL allows the user to select and aggregate the data.
2. Service Discovery
- Next and very important component of Prometheus Server is the Service Discovery.
- With the help of Service discovery the services are identified which need to be scraped.
- To Pull metrics, identification of services and finding the targets are compulsory needed.
- Through Service discovery we monitor the entities and can also locate its targets.
3. Scrape Target
- Once the services are identified and the targets are ready then we can pull metrics from it and can scrape the target.
- We can export the data of the end point using node exporters.
- Once the metrics or other data is pulled, Prometheus stores it in a local storage.
4. Alert Manager
- Alert Manager handles the alerts which may occurs during the session.
- Alert manager handles all the alerts which are sent by the Prometheus server.
- Alert manager is one of the very useful components of the Prometheus tool.
- If in case any big error or any issue occurs, alert manager manage those alerts and contact with human via E-mail, Text Messages, On-call, or any other chat application service.
5. User Interface
- User interface is also an important component as it builds a bridge between the user and the system.
- In Prometheus, user interfaces are note that much user friendly and can be used till graph queries.
- For good exclusive dashboards Prometheus works together with Grafana (visualization tool).
- Using Grafana over Prometheus to visualize properly we can use custom dashboards.
- Grafana dashboards display via pie charts, line charts, tables, good data graphs of CPU usage, RAM utilization, network load, etc with indicators.
- Grafana supports and run with Prometheus by querying language i.e. PromQL.
- To fetch data from Prometheus and to display the results on Grafana dashboards PromQL is used.
Prometheus metrics
The Prometheus client libraries offer four core metric types.
1. Counter
A counter is a cumulative metric that represents a single monotonically increasing counter whose value can only increase or be reset to zero on restart.
2. Gauge
A gauge is a metric that represents a single numerical value that can arbitrarily go up and down.
3. Histogram
A histogram samples observations and counts them in configurable buckets.
4. Summary
Similar to a histogram, a summary samples observations. While it also provides a total count of observations and a sum of all observed values, it calculates configurable quantiles over a sliding time window.
How to Install Prometheus on Amazon Linux 2
Create a system user for Prometheus using below commands:
sudo useradd --no-create-home --shell /bin/false prometheus
Create the directories in which we will be storing our configuration files and libraries with this commands:
sudo mkdir /etc/prometheus
sudo mkdir /var/lib/prometheus
Set the ownership of the /var/lib/prometheus directory with below command:
sudo chown prometheus:prometheus /var/lib/prometheus
You need to inside /tmp :
cd /tmp/
Download prometheus using wget using below command, if you want download latest prometheus then visit prometheus download page
wget https://github.com/prometheus/prometheus/releases/download/v2.31.1/prometheus-2.31.1.linux-amd64.tar.gz
Extract the files using tar :
tar -xvf prometheus-2.31.1.linux-amd64.tar.gz
You need to inside prometheus-2.31.1.linux-amd64 so run the below command:
cd prometheus-2.31.1.linux-amd64
Move the configuration file and set the owner to the prometheus user:
sudo mv console* /etc/prometheus
sudo mv prometheus.yml /etc/prometheus
sudo chown -R prometheus:prometheus /etc/prometheus
Move the binaries and set the owner:
sudo mv prometheus /usr/local/bin/
sudo chown prometheus:prometheus /usr/local/bin/prometheus
Create the prometheus service file using below command:
sudo nano /etc/systemd/system/prometheus.service
Add the below line in this /etc/systemd/system/prometheus.service
[Unit]
Description=Prometheus
Wants=network-online.target
After=network-online.target

[Service]
User=prometheus
Group=prometheus
Type=simple
ExecStart=/usr/local/bin/prometheus \
    --config.file /etc/prometheus/prometheus.yml \
    --storage.tsdb.path /var/lib/prometheus/ \
    --web.console.templates=/etc/prometheus/consoles \
    --web.console.libraries=/etc/prometheus/console_libraries

[Install]
WantedBy=multi-user.target
Reload systemd using below command:
sudo systemctl daemon-reload
Enable Prometheus service using below commands:
sudo systemctl enable prometheus
Start Prometheus service using below commands:
sudo systemctl start prometheus
Use below command to enable prometheus service in firewall or AWS security group.
sudo firewall-cmd --add-service=prometheus --permanent
sudo firewall-cmd --reload
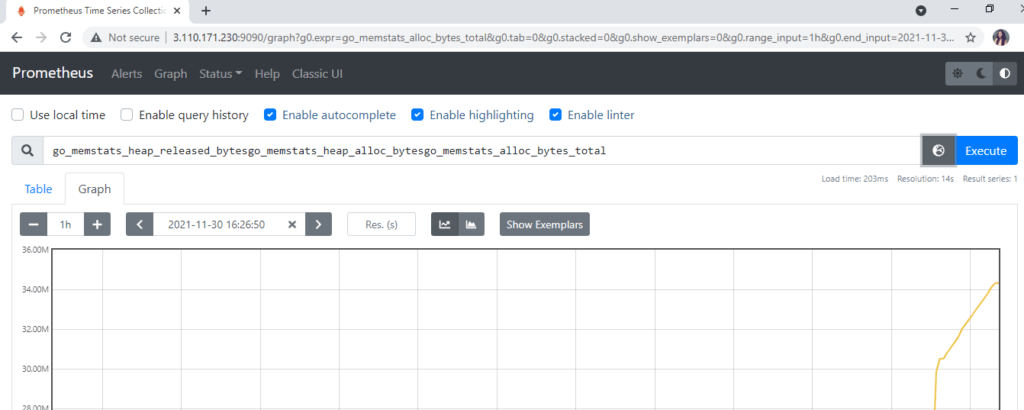
Now Prometheus service is ready to run and we can access it from any web browser.
http://server-IP-or-Hostname:9090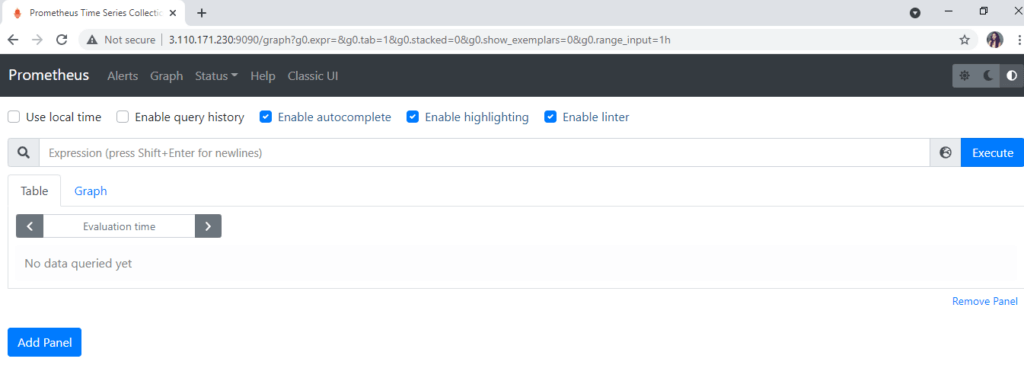
Here are some snapshots of Prometheus dashboards and graphs.
Conclusion:
We have covered What is Prometheus, Why to use Prometheus, Prometheus Architecture,Prometheus Components,How to Install Prometheus on Amazon Linux 2.
Related Articles:
This helped me a lot! Thank you!!
thanks for the share , please can you help with integrating thanos with the prometheus, most of the materials am seeing are k8s or docker related.