In this article, we will see How to Integrate AWS CloudWatch with Grafana | how to seamlessly integrate AWS CloudWatch with Grafana to unlock powerful monitoring capabilities for your AWS infrastructure. By combining the robust monitoring features of CloudWatch with the advanced visualization and analytics capabilities of Grafana, you can gain deeper insights into the performance, health, and behavior of your AWS resources.
Table of Contents
Prerequisites
- An AWS account with permissions to access AWS CloudWatch metrics.
- An instance of Grafana installed and running. You can install Grafana on-premises, using Docker, or on cloud platforms like AWS EC2 using helm chart.
- Basic knowledge of AWS services and Grafana.
- AWS RDS instance running.
What is AWS CloudWatch?
AWS CloudWatch is a comprehensive monitoring service that provides real-time insights into AWS resources’ performance and health. It collects and tracks metrics, monitors logs, sets alarms, and automatically responds to changes in AWS resources. With CloudWatch, users can optimize resource utilization, troubleshoot issues, and ensure the reliability of their AWS infrastructure.
Why integrate AWS CloudWatch with Grafana?
Integrating AWS CloudWatch with Grafana enhances monitoring by leveraging Grafana’s powerful visualization capabilities to create dynamic dashboards for AWS resources. It allows users to gain deeper insights, track metrics in real-time, and customize visualizations for effective analysis of AWS infrastructure performance. By combining CloudWatch’s monitoring data with Grafana’s flexible dashboards, users can optimize resource management and ensure the reliability of their AWS environment.
Step #1:Login to Grafana
First Login to Grafana by using the default username admin and password admin.

It will ask to change the password. You can either change it or skip this step.
Step #2:Configure CloudWatch Data Source in Grafana
Once you logged in, click on Home from the left and from Connections select the Data sources.

after that click on Add data source

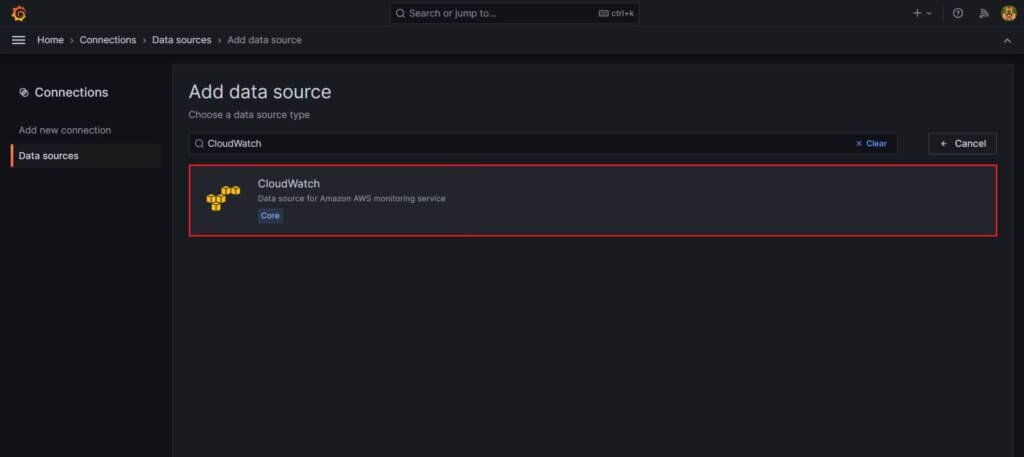
Now search for cloudwatch in the search bar and select it.
Here you need to select the Access and secret key under the Authentication provider. Then provide the Access Key ID, Secret Access Key and Default Region
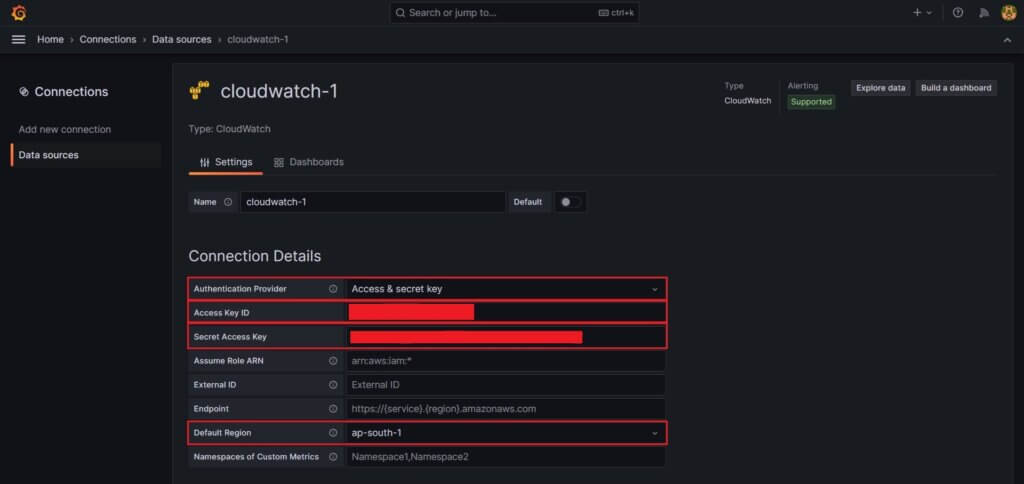
click on save and test.

Once its done you will see the following output.

Step #3:Create new Dashboard in Grafana
Now head back to the main screen and click on the home from left, select the Dashboards to create new dashboard.

click on Create dashboard to create a new dashboard.

Select the add visualization option.

you will come to the default page which is shown below.

Step #4:Monitor AWS EC2 instance in Grafana
here provide the
- Namespace: AWS/EC2
- Metric name: CPUUtilization
- Dimensions: InstanceID = Select an EC2 instance you want to monitor.
- We’ve taken region and statistic as default.
then click on run queries.

Output:
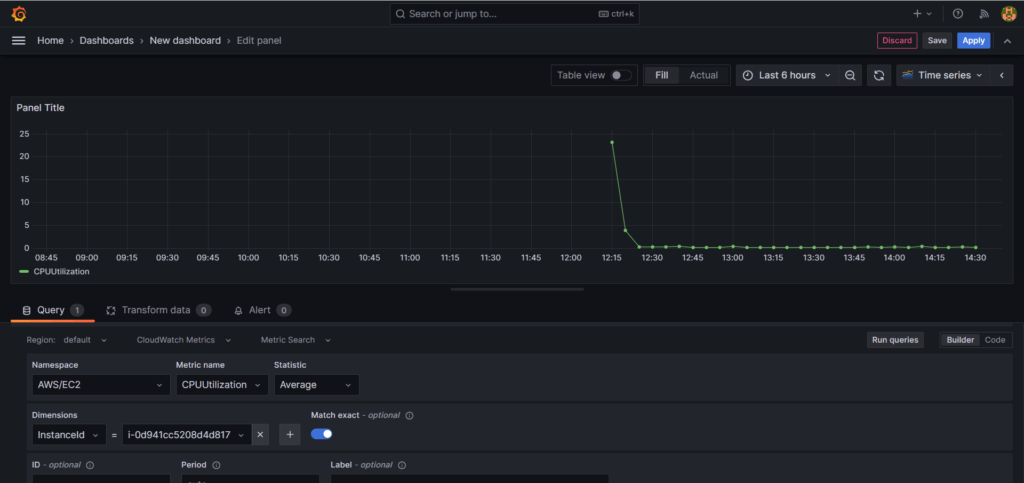
you should see the output like above in a Time series format but their are more visualization options out there
for example, Gauge

Step #5:Monitor AWS RDS in Grafana
We can create a dashboard for AWS RDS instance also
here provide the
- Namespace: AWS/RDS
- Metric name: CPUUtilization
- Dimensions: DBInstanceIdentifier = Select an RDS instance you want to monitor.
- We’ve taken region and statistic as default.
then click on run queries.

Output:

the above output is in Time series format while the below is in Bar chart. There are many Visualization option and can select anyone you want.

Conclusion:
Integrating AWS CloudWatch with Grafana provides a powerful solution for monitoring and visualizing AWS resources. By following the steps outlined in this guide, users can seamlessly set up the integration, import pre-configured dashboards, and customize them to suit their monitoring needs. With enhanced visibility into AWS infrastructure, organizations can proactively identify and address issues, optimize performance, and ensure the reliability of their cloud-based applications.
Related Articles:
Secure Grafana with Nginx, Reverse Proxy and Certbot
Reference: