In this article, How to Monitor Linux Server Metrics with Prometheus, we will delve into the comprehensive process of monitoring Linux Server metrics with Prometheus.
Table of Contents
What is Prometheus?

Prometheus is an open-source monitoring and alerting toolkit designed for reliability and scalability in modern, dynamic environments. Developed by the Cloud Native Computing Foundation, Prometheus excels at collecting and storing time-series data, allowing users to gain valuable insights into the performance and health of their applications and infrastructure.
With its powerful query language and support for multi-dimensional data, Prometheus has become a popular choice for monitoring systems within cloud-native ecosystems.
What is Node Exporter ?
- Node exporter is one of the Prometheus exporters which is used to expose servers or system OS metrics.
- With the help of Node exporter we can expose various resources of the system like RAM, CPU utilization, Memory Utilization, disk space.
- Node exporter runs as a system service which gathers the metrics of your system and that gathered metrics is displayed with the help of Grafana visualization tool.
Prerequisites
To follow this tutorial, you will need:
- AWS Ubuntu 22.04 LTS Instance.
- User with sudo access (see the Initial Server Setup with Ubuntu 22.04 tutorial for details).
- Install Prometheus and on Ubuntu Server and Enable Port:9090 & 9100.
How to Monitor Linux Server Metrics with Prometheus
Step#1:Install Node Exporter on Ubuntu
Node exporter is responsible for fetching the statistics from various hardware and virtual resources in the format which Prometheus can understand and with the help of the prometheus server those statistics can be exposed on port 9100.
Here are the download and installation steps –
- Download the binary of Node exporter based on the operating system.
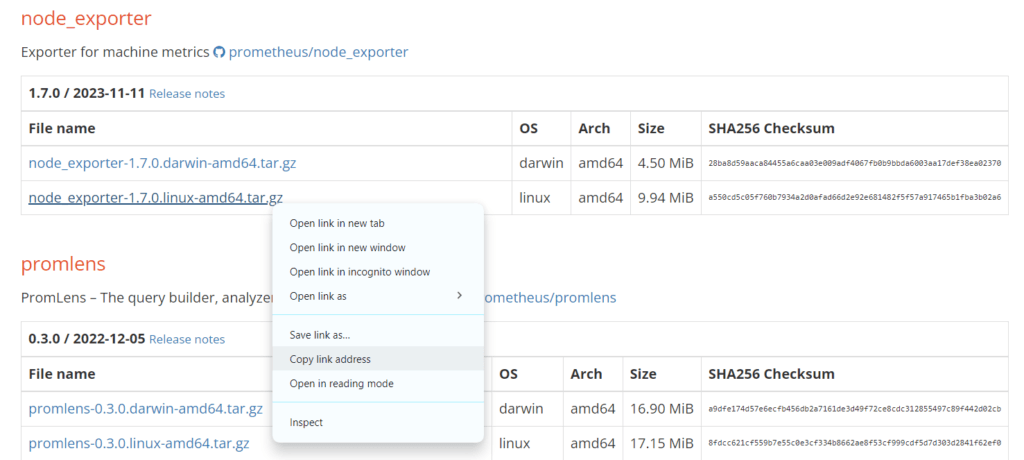
- Now install Node exporter on Ubuntu Server:
wget https://github.com/prometheus/node_exporter/releases/download/v1.7.0/node_exporter-1.7.0.linux-amd64.tar.gz

- Extract the download node exporter binary file
tar xvfz node_exporter-*.*-amd64.tar.gz

- Start the node exported with the command
./node_exporter
- Access the Node exporter metrics on the browser with URL –
http://localhost:9100


Move the binary file of node exporter to /usr/local/bin location.
sudo mv node_exporter-1.7.0.linux-amd64/node_exporter /usr/local/bin/
Create a node_exporter user to run the node exporter service.
sudo useradd -rs /bin/false node_exporter
Step#2:Create a node_exporter service file in the /etc/systemd/system directory
sudo nano /etc/systemd/system/node_exporter.service
Paste the below content in your service file
[Unit]
Description=Node Exporter
After=network.target
[Service]
User=node_exporter
Group=node_exporter
Type=simple
ExecStart=/usr/local/bin/node_exporter
[Install]
WantedBy=multi-user.target
Now lets start and enable the node_exporter service using below commands
sudo systemctl daemon-reload
sudo systemctl start node_exporter
Lets Check the Status of Node Exorter:
sudo systemctl status node_exporter
![Install Prometheus Node Exporter on Linux [2 Steps] 2](https://www.fosstechnix.com/wp-content/uploads/2021/12/node-exporter-status-2-1024x316.png)
Step#3:Adding node exporter to prometheus.yml configuration
sudo nano prometheus.yml
scrape_configs:
  # The job name is added as a label `job=<job_name>` to any timeseries scraped from this config.
  - job_name: "prometheus"

    # metrics_path defaults to '/metrics'
    # scheme defaults to 'http'.

    static_configs:
      - targets: ["localhost:9090"]

  - job_name: "node"

    # metrics_path defaults to '/metrics'
    # scheme defaults to 'http'.

    static_configs:
      - targets: ["localhost:9100"]

After changing in config file you need to restart to prometheus
Now restart the Prometheus Service
sudo systemctl restart prometheus
Step#4:Verify the Host status on Prometheus server


Step#5:Examples to Monitor Metrics on Prometheus
1.What is node_cpu_seconds_total metric?
node_cpu_seconds_total is a metric commonly used in monitoring systems like Prometheus to track the total amount of CPU time consumed by a node or server. It measures the cumulative CPU time in seconds across all CPU cores since the node started or since the metric was reset. This metric helps in understanding CPU utilization and performance of the node over time.
For example:
- If your server has been running for 10 hours and the
node_cpu_seconds_totalmetric shows 36000 (10 hours * 60 minutes * 60 seconds), it means that the CPUs have collectively used 10 hours of CPU time. - This metric helps in understanding how intensively the CPUs are working and can be used to monitor performance, diagnose issues related to CPU utilization, and optimize resource allocation.
In monitoring systems like Prometheus, you can query and visualize this metric to keep track of your server’s CPU usage over time.


Graph:

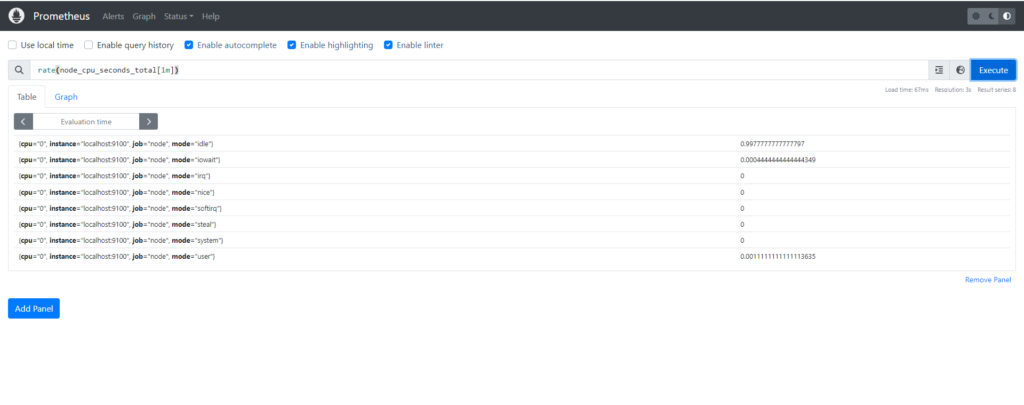
Wrap the Rate Function to get the current usage:
rate(node_cpu_seconds_total[1m])
To gain the current CPU usage, you can use the rate() function with a time range of 1 minute ([1m]) applied to the node_cpu_seconds_total metric. This function calculates the per-second average rate of increase of the metric over the last 1 minute.
This query will give you the average rate of CPU usage per second over the last 1 minute. You can use this metric to understand the current CPU utilization trend and take necessary actions if needed, such as scaling resources or investigating performance issues.

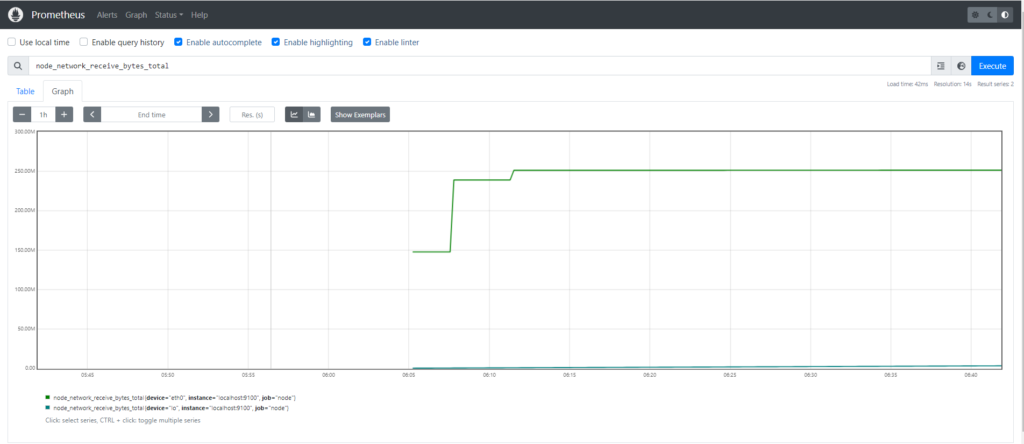
2.What is node_network_receive_bytes_total metric?
The node_network_receive_bytes_total metric is used to monitor the total number of bytes received on all network interfaces of a node or server. It provides insights into the amount of inbound network traffic the node has processed since it started or since the metric was last reset.
For example:
- Let’s say you have a server hosting a website. The node_network_receive_bytes_total metric would track the total amount of data received by the server from clients accessing the website.
- If the metric shows a value of 100,000, it means the server has received 100,000 bytes of data across all its network interfaces since the metric started counting.
This metric helps in monitoring network activity, diagnosing network performance issues, and understanding the data transfer patterns of the server. It’s often used in conjunction with other network-related metrics to gain a comprehensive view of network utilization and performance.

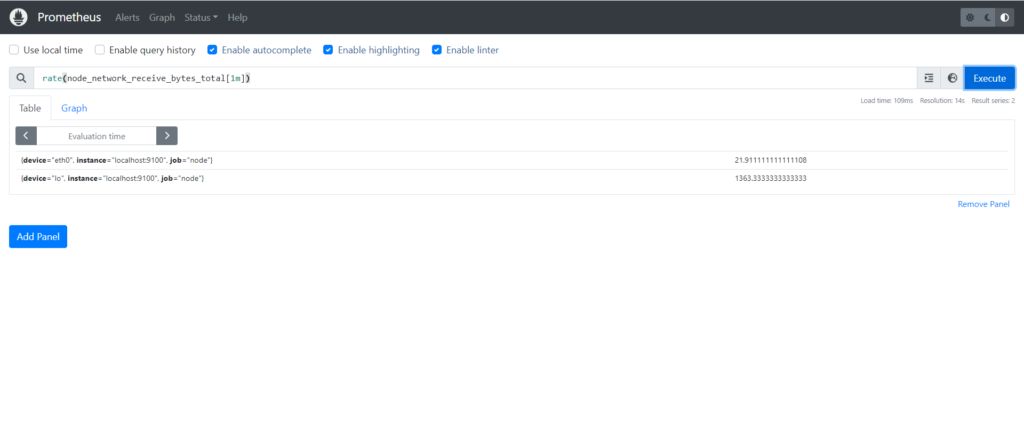
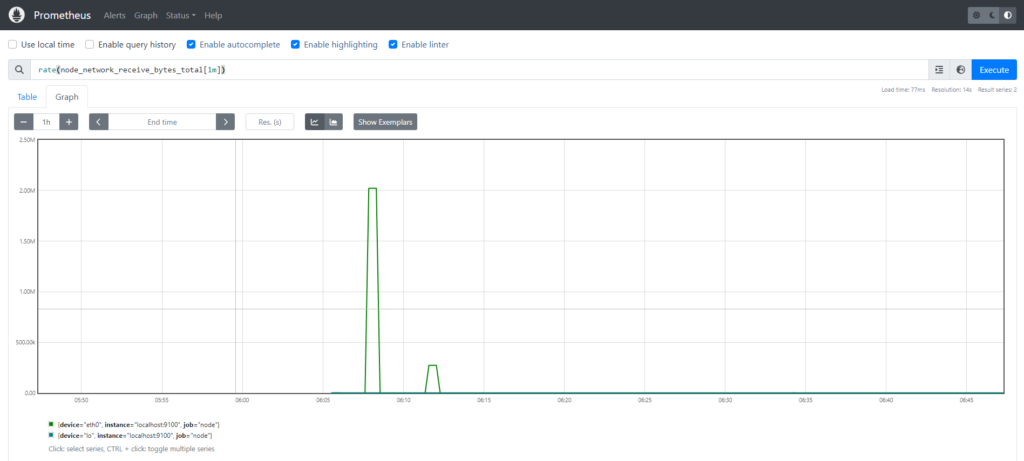
Wrap the Rate Function to around this metric to see per second how many bytes are receiving:
rate(node_network_receive_bytes_total[1m])
rate(node_network_receive_bytes_total[1m]) gives the average rate of change of bytes received on all network interfaces over the last minute. It’s a measure of network traffic intensity.
For example,
If you have a server, rate(node_network_receive_bytes_total[1m]) would show how fast data is coming into the server’s network interfaces over the last minute. For instance, if it returns 100 bytes per second, it means the server received an average of 100 bytes per second over the past minute.
Conclusion:
In conclusion, monitoring Linux server metrics with Prometheus provides a robust approach to understanding system performance and resource usage. By integrating Prometheus for data collection, administrators can proactively manage server health, optimize resource allocation, and ensure reliable operations.
Related Articles:
How to Install Prometheus on Ubuntu 22.04 LTS
Secure Grafana with Nginx, Reverse Proxy and Certbot
Reference: