In this article we will learn how to Send Microsoft Teams Alert Using Elastic Stack. Monitoring systems generate critical alerts that need immediate attention. While Kibana provides powerful visualization and alerting capabilities, integrating it with collaboration tools like Microsoft Teams ensures that the right people get notified in real time. Today, we’ll walk through setting up Kibana to send alerts directly to a Microsoft Teams channel using webhook connectors, keeping your team informed without switching platforms.
Table of Contents
Prerequisites
- AWS Account with Ubuntu 24.04 LTS EC2 Instance.
- At least 2 CPU cores and 4 GB of RAM for smooth performance.
- Docker and Docker Compose installed.
Step #1:Install Docker and Docker Compose
First update the package list.
sudo apt update
If Docker and Docker Compose are not already installed, you can install them using the following command.
sudo apt install -y docker.io docker-compose
docker.io: Installs the Docker engine.docker-compose: Installs Docker Compose for managing multi-container applications.
Step #2:Create Docker Compose File
Create a Docker Compose YAML file to define the Elastic Stack services.
sudo nano docker-compose.yml
Paste the following content into the file.
version: "3"
services:
  elasticsearch:
    image: "docker.elastic.co/elasticsearch/elasticsearch:8.17.2"
    environment:
      - "ES_JAVA_OPTS=-Xms1g -Xmx1g"
      - "discovery.type=single-node"
    ports:
      - "9200:9200"
    volumes:
      - elasticsearch_data:/usr/share/elasticsearch/data

  kibana:
    image: "docker.elastic.co/kibana/kibana:8.17.2"
    ports:
      - "5601:5601"

  filebeat:
    image: "docker.elastic.co/beats/filebeat:8.17.2"
    user: root
    volumes:
      - /MY_WORKDIR/filebeat.yml:/usr/share/filebeat/filebeat.yml:ro
      - /var/lib/docker:/var/lib/docker:ro
      - /var/run/docker.sock:/var/run/docker.sock

  metricbeat:
    image: docker.elastic.co/beats/metricbeat:8.17.2
    user: root
    volumes:
      - /MY_WORKDIR/metricbeat.yml:/usr/share/metricbeat/metricbeat.yml:ro
      - /var/run/docker.sock:/var/run/docker.sock
      - /sys/fs/cgroup:/hostfs/sys/fs/cgroup:ro
      - /proc:/hostfs/proc:ro
      - /:/hostfs:ro

volumes:
  elasticsearch_data: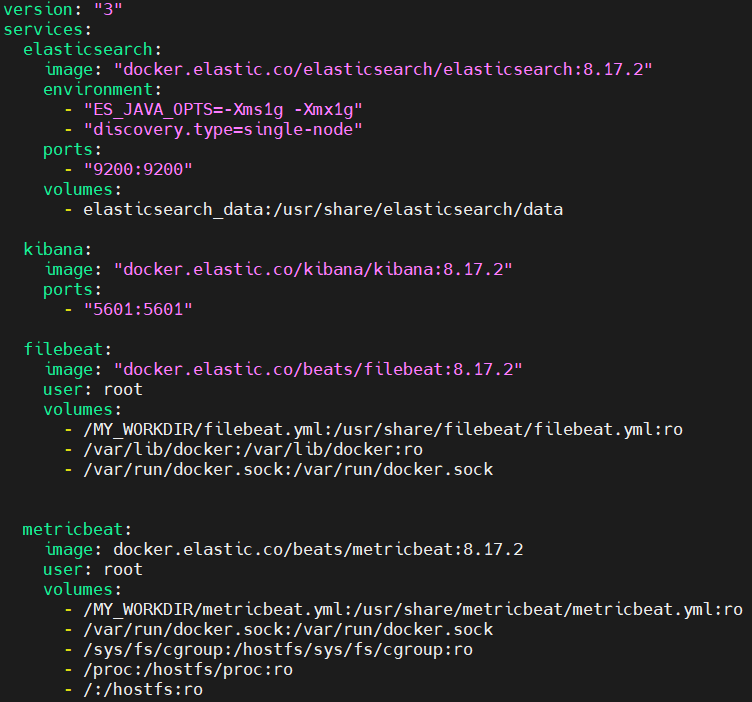
Step #3:Prepare Configuration Files For Beats
Create a working directory for your configuration files.
sudo mkdir /MY_WORKDIR
Inside the directory create a filebeat.yml file.
sudo nano /MY_WORKDIR/filebeat.yml
Paste the following config in it.
filebeat.inputs:
- type: container
  paths:
    - '/var/lib/docker/containers/*/*.log'

processors:
- add_docker_metadata:
    host: "unix:///var/run/docker.sock"

- decode_json_fields:
    fields: ["message"]
    target: "json"
    overwrite_keys: true

output.elasticsearch:
  hosts: ["elasticsearch:9200"]
  indices:
    - index: "filebeat-%{[agent.version]}-%{+yyyy.MM.dd}"

logging.json: true
logging.metrics.enabled: false
Create a metricbeat.yml file.
sudo nano /MY_WORKDIR/metricbeat.yml
Paste the following config in it.
metricbeat.modules:
- module: system
  metricsets:
    - cpu
    - memory
    - network
    - filesystem
    - process
    - process_summary
  enabled: true
  period: 10s
  processes: ['.*']
  hostfs: "/hostfs"

- module: docker
  metricsets:
    - container
    - cpu
    - diskio
    - healthcheck
    - info
    - memory
    - network
  hosts: ["unix:///var/run/docker.sock"]
  period: 10s
  enabled: true

output.elasticsearch:
  hosts: ["http://elasticsearch:9200"]

monitoring:
  enabled: true
Step #4:Start the Elastic Stack using Docker Composer
Start the services using Docker Compose.
sudo docker-compose up -d
Verify that the containers are running.
sudo docker ps -a
Step #5:Set Password for Elastic User
Elasticsearch 8.x enables security by default. Reset the password for the elastic user using following command.
sudo docker exec -it ubuntu_elasticsearch_1 /usr/share/elasticsearch/bin/elasticsearch-reset-password -u elastic -i
Update the Filebeat configuration to include the Elasticsearch credentials.
sudo nano /MY_WORKDIR/filebeat.yml
Add the username and password fields under output.elasticsearch.
output.elasticsearch:
  hosts: ["elasticsearch:9200"]
  username: "elastic"
  password: "devopshint"
  indices:
    - index: "filebeat-%{[agent.version]}-%{+yyyy.MM.dd}"
Save and exit the file.
Update the Metricbeat configuration to include the Elasticsearch credentials.
sudo nano /MY_WORKDIR/metricbeat.yml
Add the username and password fields under output.elasticsearch.
output.elasticsearch:
  hosts: ["elasticsearch:9200"]
  username: "elastic"
  password: "devopshint"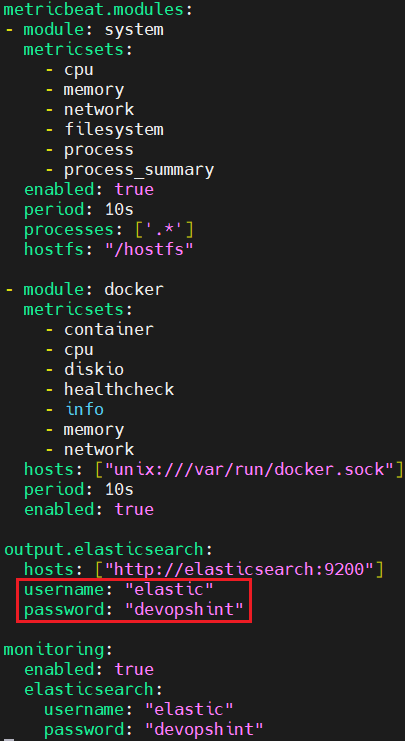
Restart the containers. First shut down the containers.
sudo docker-compose down
Then start them again.
sudo docker-compose up -d
Step #6:Secure Kibana with Service Token
To securely connect Kibana to Elasticsearch, generate a service account token.
curl -u elastic:devopshint -X POST "http://localhost:9200/_security/service/elastic/kibana/credential/token/my-token"; echo
Save the value field from the response.
Generate an encryption key.
openssl rand -hex 32
Save the generated encryption key.
Update the docker-compose.yml file to include the service account token and encryption keys.
sudo nano docker-compose.yml
Add the following environment variables to the kibana service.
kibana:
  image: "docker.elastic.co/kibana/kibana:8.17.2"
  ports:
    - "5601:5601"
  environment:
    - ELASTICSEARCH_HOSTS=http://elasticsearch:9200
    - ELASTICSEARCH_SERVICEACCOUNTTOKEN=AAEAAWVsYXN0aWMva2liYW5hL215LXRva2VuOnEwby1YUGlyU1JhZnFxaEozS012aVE
    - XPACK_SECURITY_ENCRYPTIONKEY=2145ee3c3cc4e7853c77e96a7cd7e0fe102ea5ffa948e368132b525af018db0c
    - XPACK_ENCRYPTEDSAVEDOBJECTS_ENCRYPTIONKEY=2145ee3c3cc4e7853c77e96a7cd7e0fe102ea5ffa948e368132b525af018db0c
    - XPACK_REPORTING_ENCRYPTIONKEY=2145ee3c3cc4e7853c77e96a7cd7e0fe102ea5ffa948e368132b525af018db0c
    - XPACK_SECURITY_SECURE_COOKIES=true
  depends_on:
    - elasticsearch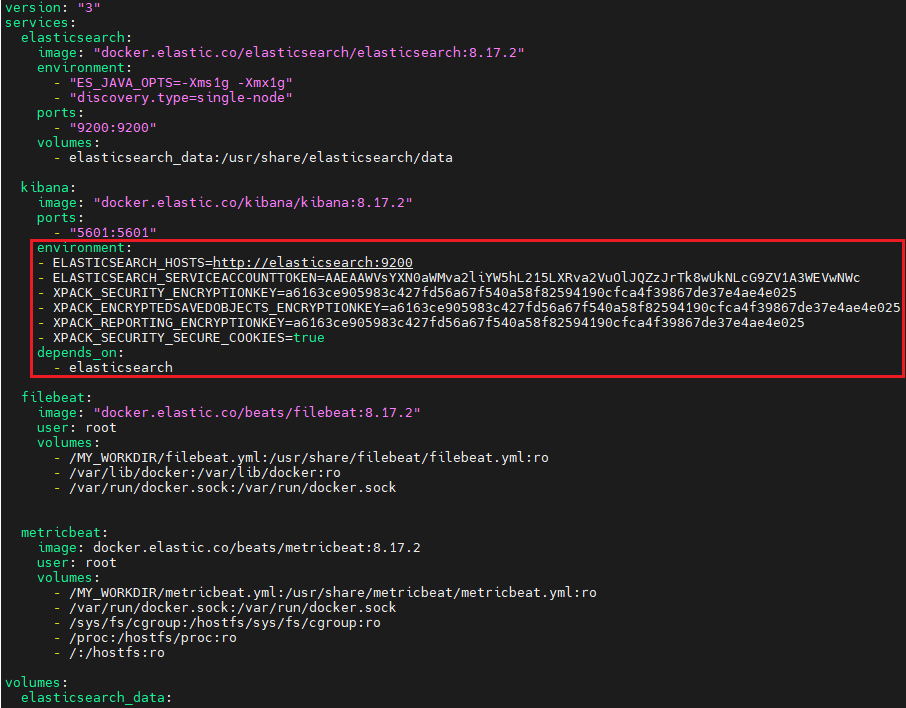
Save and exit the file.
Restart the services.
sudo docker-compose down
sudo docker-compose up -d
Verify that the containers are running.
sudo docker ps -a
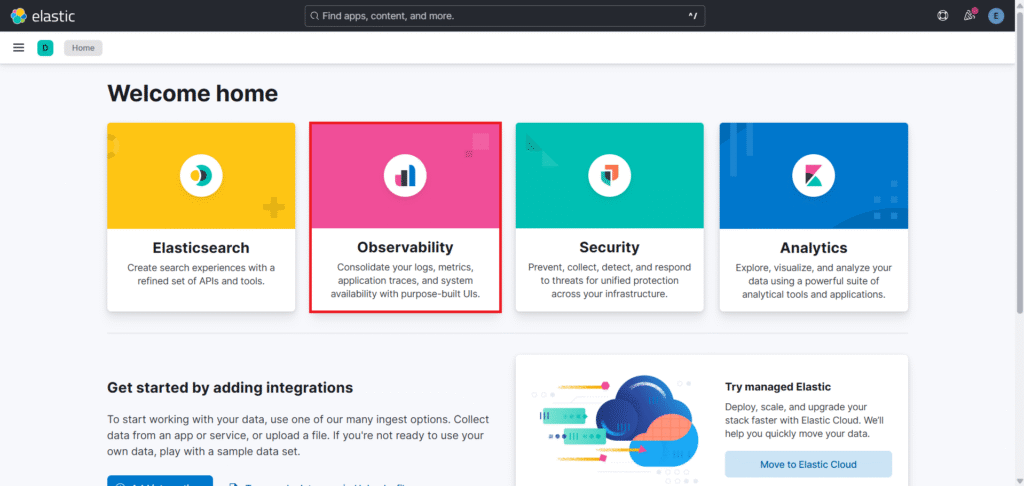
Step #7:Access Kibana Observability
Open your browser and navigate to http://<EC2-PUBLIC-IP>:5601. Log in using the elastic username and the password you set earlier.

Click on Explore on my own.

Go to Observability.
You will see the Overview there.

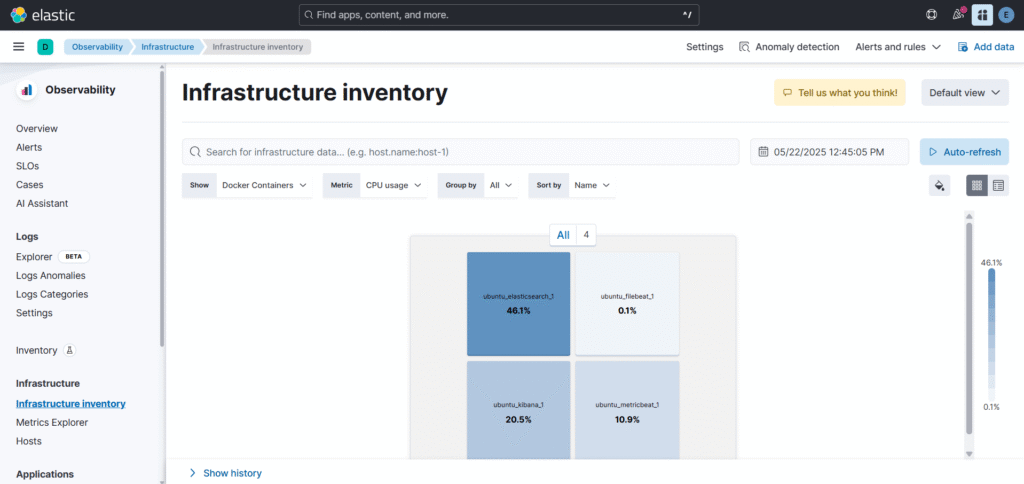
Now lets go to Infrastructure Inventory to see the metrics.
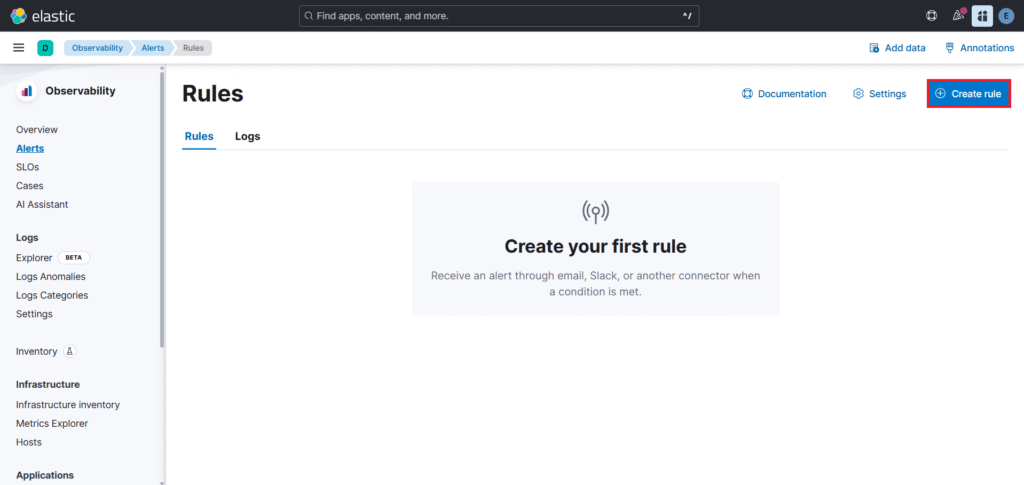
Step #8:Create an Alert
Next lets set up alert for that go to Alerts as shown below and click on Manage Rules.

Click on Create rule to create a rule for alert.
We will create a Metric threshold rule.

Write a Name for your rule like Microsoft Teams Alert. As conditions as
- WHEN Average
- OF system.cpu.total.pct
- IS ABOVE 0.9 %
And click on Save.

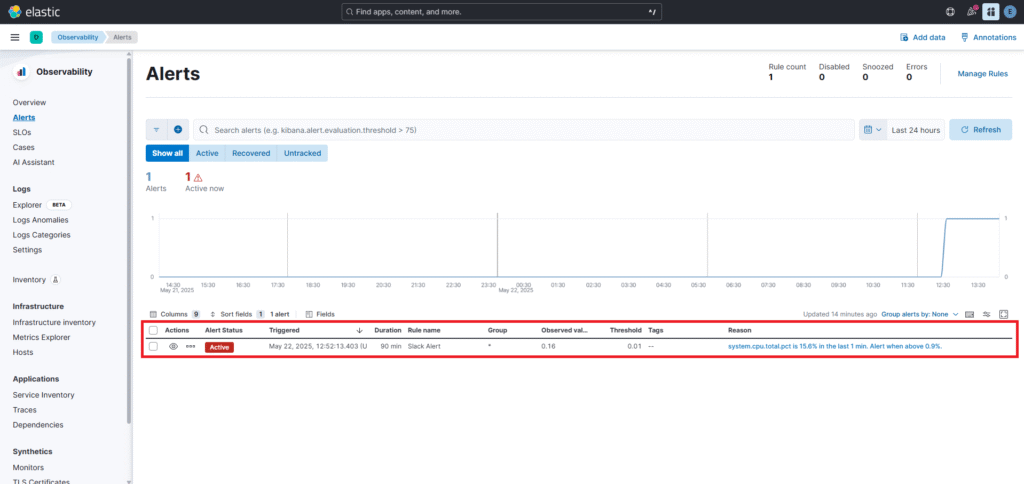
You can see the rule is created successfully. Now go back to Alerts.

As you can see below alert is triggered.
Step #9:Create a Microsoft Teams Channel
Open your Microsoft Teams Account.

Go to Teams . Then Click on Join or create team from the top-right corner. After this click on Create team.

Select Other as a template to create a team.

Click on Use this template. It will create a General Channel.

Then we will create a Private team.

Enter the Team name like ELK Alerts and add a Description like Focused on Monitoring and Alerting. Then Click on Create.

As you can see our team “ELK Alerts” is created.

Now lets create a channel for our alerts, for that click “…” next to the ELK Alerts and select Add channel option.

Enter the Channel name like MS Teams Alert. Choose a channel type as Standard. Then click on Create.

Step #10:Configure Microsoft Teams Alert in Kibana
As you can see our MS Teams channel is created.

Now go to Apps.

Search for Incoming Webhooks and click on it.

Click on Add to add it in Microsoft Teams.

Then Select a channel MS Teams Alert which we have created to use the app. And click on Go.

Now To set up an Incoming Webhook, you need to provide a name so give it like Kibana Alerts. Click on Create.

Scroll down and you will see the URL generate. Copy it cause we will use it in Kibana Connector.

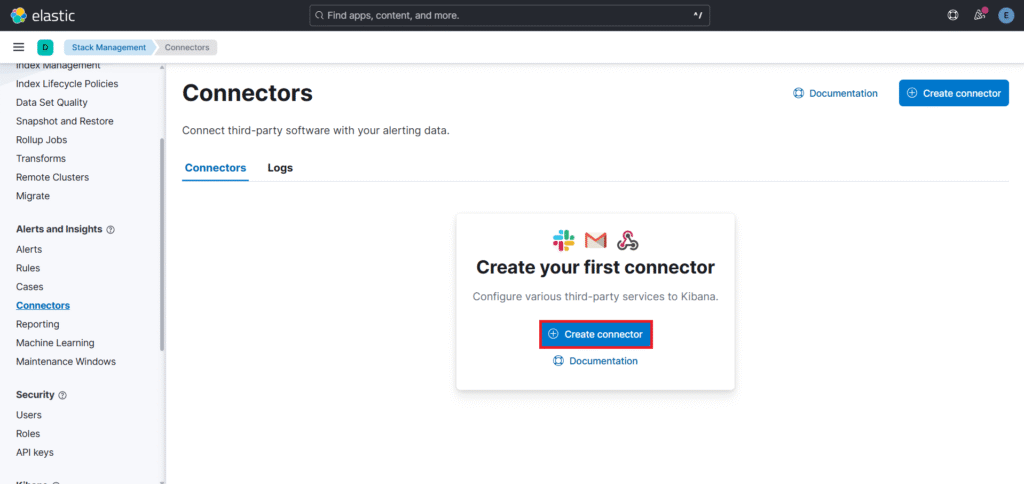
Now go back to kibana dashboard and select the Stack Management.

Go to the Connectors.

Click on Create connector.
To set up an Slack connector you need to upgrade your license so go to Manage license.

Select Start trial to Start a 30-day trial.
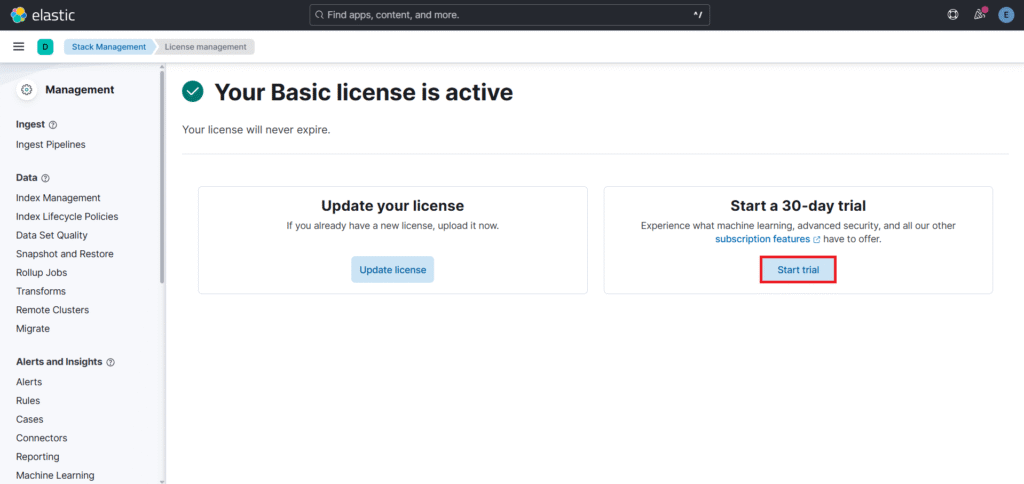
Click on Start my trial.

Now you can see Our Trial license is active.

Now again go back to connectors and select Microsoft Teams as a connector.

Enter the Connector name like MS ELK Connector. And in Connector settings Enter the webhook URL which we have copied. Click on Save and test.

You need to enter the message CRITICAL: High CPU Usage !! then Run the Test.

you will see the Test was successful message.

Now go back to Microsoft Teams you will see the alert as shown below.

Now go back to MS Teams Alerts and Click on Action – Edit rule.

Select Microsoft Teams as a Connector.

Click on Save.

You can see in below image our action has been added.

Now when alert is triggered you will get the message in format specified in Microsoft Teams Alert Connector. Shown below.

Conclusion:
Now that your Elastic Stack alerts are connected to Microsoft Teams, your team will be instantly notified when an issue arises. This setup helps you respond to problems faster and keep your systems healthy. You no longer have to rely only on dashboards or emails to catch critical issues. Whether it’s a spike in error logs or an infrastructure anomaly, Teams alerts ensure that the right people are notified instantly. With this simple integration, your alerts go straight to your collaboration space. It saves time and improves teamwork.
Related Articles:
Send Email Alerts Using Elastic Stack
Observability Dashboard Overview in Elastic Stack
Observability Dashboard Overview in Elastic Stack (Logs and Infrastructure) – Part 2
Reference: