In this article, What is a Data Sources in Grafana | we will discover the power of Grafana’s data sources to elevate your data visualization game in this comprehensive guide. Gain expert insights and strategies for effective data-driven decision-making.
Table of Contents
What is Grafana?

Grafana is an open source tool for performing data analytics, retrieving metrics that make sense of large amounts of data, and monitoring our apps using nice configurable dashboards.
Grafana integrates with a wide range of data sources, including Graphite, Prometheus, Influx DB, ElasticSearch, MySQL, PostgreSQL, and others. When connected to supported data sources, it provides web-based charts, graphs, and alert.
What is a Data Sources in Grafana?
In Grafana, a data source is a connection to a specific database or service that provides the data to be visualized in Grafana dashboards. Grafana supports a variety of data sources, including relational databases, time-series databases, cloud-based data storage, and more.
When you create a dashboard in Grafana, you typically need to connect it to one or more data sources to pull in the data you want to display. Each data source has its own configuration settings, and Grafana uses these settings to establish a connection and retrieve data for visualization.
Benefits of using Data Sources in Grafana
- Data Integration: Grafana supports a wide range of data sources, allowing seamless integration with various databases, cloud services, and third-party applications.
- Multi-Data Source Dashboards: Users can create dashboards that pull data from multiple sources, providing a holistic view of their data landscape in a single, unified interface.
- Real-Time Monitoring: Utilize real-time data sources to monitor and visualize changes as they happen, enabling quick decision-making and response to dynamic scenarios.
- Historical Analysis: Leverage historical data sources to analyze trends, patterns, and performance over time, aiding in retrospective analysis and long-term strategy planning.
- Extensibility: Grafana’s extensible architecture allows users to create custom data sources, enabling integration with proprietary systems or specialized databases.
- Alerting and Notifications: Integrate data sources with alerting systems to receive instant notifications based on predefined thresholds, ensuring proactive responses to critical events.
- Cloud-Native Capabilities: Grafana seamlessly connects with cloud-native data sources, making it an ideal choice for organizations leveraging cloud platforms for data storage and analytics.
- Optimized Performance: Choose data sources that align with your specific use case, optimizing performance and ensuring efficient handling of large datasets for smoother visualization experiences.
- Collaborative Analytics: Facilitate collaboration by sharing dashboards that draw data from common sources, fostering a cohesive and data-driven decision-making culture within teams.
- Scalability: As your data needs grow, Grafana’s support for scalable data sources ensures that your visualization platform can evolve with your expanding data infrastructure.
Grafana Data Sources Real-time Use Case
Consider a scenario in which an e-commerce company uses Grafana with real-time data sources to enhance its operations:
- Order Processing Dashboard:
- Data Source: Connects to the company’s transactional database.
- Real-Time Scenario: The dashboard pulls data directly from the order processing system, providing real-time insights into order volumes, successful transactions, and any issues in processing orders. This allows the operations team to monitor the health of the system, identify potential bottlenecks, and swiftly respond to any disruptions in the order fulfillment process.
- Website Traffic Monitoring:
- Data Source: Integrates with web server logs or Google Analytics.
- Real-Time Scenario: By tapping into real-time web traffic data, Grafana enables the marketing and analytics teams to monitor website traffic patterns, user engagement, and popular product pages as they happen. This immediate feedback helps marketers make data-driven decisions on promotions, optimize website content, and enhance the overall user experience.
- Inventory Management:
- Data Source: Connects to the inventory management system.
- Real-Time Scenario: The inventory dashboard provides a live view of stock levels, order fulfillment, and product availability. Warehouse managers can use this real-time data to make decisions on restocking, prevent stockouts, and optimize the allocation of resources for efficient order processing.
- Payment Gateway Performance:
- Data Source: Integrates with the payment gateway API.
- Real-Time Scenario: Grafana pulls data from the payment gateway to monitor transaction success rates, detect anomalies in payment processing times, and identify any issues with payment gateways in real-time. This allows the finance team to ensure secure and seamless payment transactions for customers.
- Customer Support Insights:
- Data Source: Integrates with the customer support ticketing system.
- Real-Time Scenario: The customer support dashboard provides real-time visibility into the volume of incoming support tickets, response times, and resolution rates. Support managers can use this data to allocate resources effectively, prioritize critical issues, and improve overall customer satisfaction by addressing concerns promptly.
In these scenarios, Grafana’s ability to connect to diverse real-time data sources empowers different teams within the organization to make informed decisions, respond quickly to changing conditions, and ultimately enhance the overall efficiency and performance of the e-commerce business.
Popular Grafana Data Sources
- Prometheus:
- Example: Ideal for monitoring and alerting in a cloud-native environment.
- Use Case: Visualizing and alerting on Kubernetes cluster metrics, application performance, and server health.
- Graphite:
- Example: Commonly used for storing and graphing time-series data.
- Use Case: Monitoring network traffic, system metrics, and application performance over time.
- InfluxDB:
- Example: A purpose-built time-series database.
- Use Case: Storing and visualizing sensor data, IoT metrics, and application performance metrics.
- Elasticsearch:
- Example: Excellent for searching, analyzing, and visualizing log data.
- Use Case: Creating dashboards that track system logs, application logs, and security event logs.
- MySQL/PostgreSQL:
- Example: Traditional relational databases.
- Use Case: Visualizing business metrics, financial data, and other structured data stored in a relational database.
- CloudWatch:
- Example: Integrated with Amazon Web Services (AWS) for monitoring AWS resources.
- Use Case: Monitoring and visualizing AWS cloud infrastructure metrics, application logs, and cost management.
- Microsoft SQL Server:
- Example: Integrates with SQL Server databases.
- Use Case: Visualizing and analyzing data stored in Microsoft SQL Server databases, such as user activity or business performance metrics.
- OpenTSDB:
- Example: A distributed and scalable time-series database.
- Use Case: Storing and analyzing large-scale time-series data, such as network performance metrics or industrial sensor data.
- Google Cloud Monitoring:
- Example: Integrated with Google Cloud Platform (GCP) for monitoring GCP resources.
- Use Case: Visualizing and alerting on cloud infrastructure metrics, application logs, and resource utilization in GCP.
- JIRA:
- Example: Connects to JIRA for tracking and managing software development projects.
- Use Case: Creating dashboards that display project progress, issue resolution times, and team performance metrics.
These popular data sources in Grafana cater to a wide range of use cases, from monitoring infrastructure and application performance to visualizing business metrics and project management data.
Popular community-driven Grafana Data Sources
- Zabbix:
- Example: An open-source monitoring solution.
- Use Case: Integrates with Grafana to visualize and alert on Zabbix-monitored data, such as server performance and network metrics.
- Prometheus Operator:
- Example: An operator for managing Prometheus instances on Kubernetes.
- Use Case: Enables Grafana to pull metrics from Prometheus, making it popular for Kubernetes and containerized environments.
- Grafana Loki:
- Example: A horizontally scalable, multi-tenant log aggregation system.
- Use Case: Integrates seamlessly with Grafana for log analysis and visualization, especially useful in cloud-native architectures.
- Grafana SimpleJson:
- Example: A simple JSON datasource.
- Use Case: Allows users to connect Grafana to various data sources that expose data in a JSON format, making it versatile for community-contributed integrations.
- Elasticsearch Datasource:
- Example: A community-built plugin for Elasticsearch.
- Use Case: Provides Grafana users with the ability to visualize and explore data stored in Elasticsearch, commonly used for log and event data.
- ClickHouse:
- Example: An open-source distributed column-oriented database.
- Use Case: Grafana users leverage ClickHouse as a community-supported data source for high-performance analytics and real-time data processing.
- PrestoDB:
- Example: An open-source distributed SQL query engine.
- Use Case: Grafana users can query and visualize data from various data sources using PrestoDB, enhancing flexibility in analytics.
- Google Sheets Datasource:
- Example: A community-driven plugin for connecting to Google Sheets.
- Use Case: Enables Grafana users to pull data directly from Google Sheets for visualization, making it accessible for business and personal data.
- Pi-hole Datasource:
- Example: Integrates with Pi-hole, a network-wide ad blocker.
- Use Case: Grafana users can visualize and monitor Pi-hole statistics, such as blocked ads and DNS queries, to enhance network management.
- GitLab Datasource:
- Example: A community-contributed plugin for GitLab integration.
- Use Case: Grafana users can track and visualize GitLab metrics, merge requests, and pipeline performance, fostering better collaboration and development insights.
These community-driven Grafana data sources showcase the collaborative spirit of the Grafana ecosystem, offering a wide array of integrations to cater to diverse user needs and preferences.
Prerequisites
- Create EC2 instance(Ubuntu 22.04 LTS) on AWS and connect that Instance using Mobaxterm Tool
- Install Grafana on Ubuntu 22.04 LTS
- Enable Port No-3000 for Grafana
How to add a Data Source in Grafana?
To add a data source in Grafana, you should hover over the icon after logging click on (Add your first DataSource)

In the Data Sources section of the Configuration menu, you can press the Add Data Source button. In the screenshot below you can see that we’ve already added data sources.If you have a fresh local installation of Grafana, you will not see any data sources here until you add them. In general, this is the place where you can view all of your connected data sources.

When you click the Add data sources button, you will see the list of officially supported data sources available for connection:
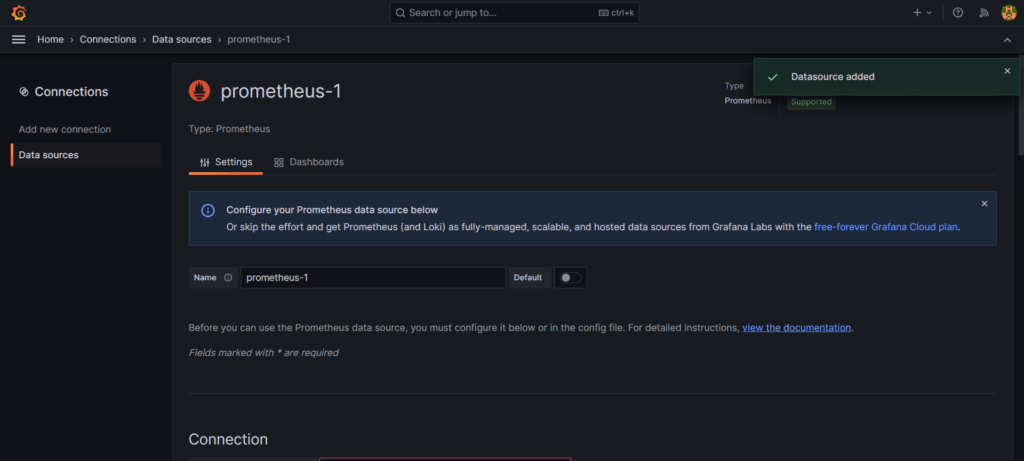
Select the preferred data source and click on it. The next step will be to specify the required parameters (URL, authorization details, names, etc.):
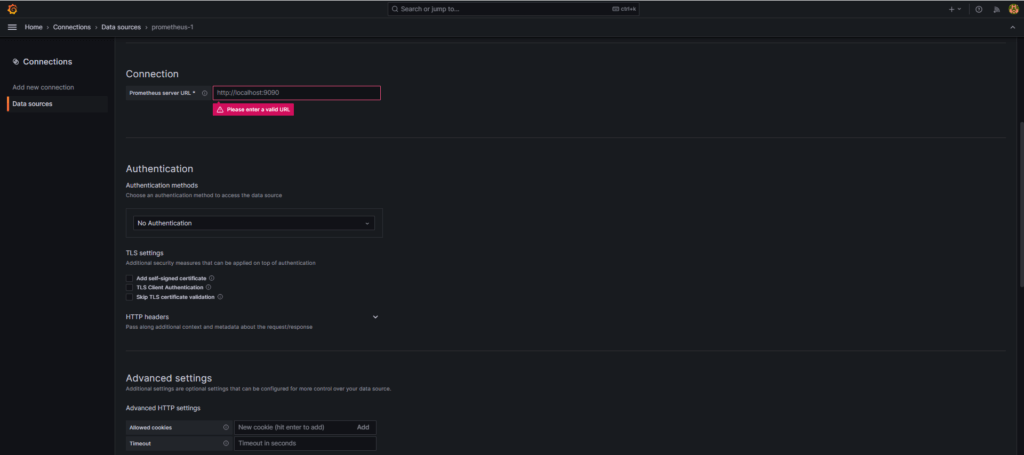
After you finish filling in the required parameters, you need to press the Save & Test button.
When Grafana establishes the connection, you will see the corresponding message. Then, you can go to the Dashboards section and start exploring the data from the connected data source.
In next article ,we will see how we can add and use Datasources like Prometheus in Grafana.
Conclusion:
In conclusion, this article explored Grafana data sources and explained how to work with them. We described a range of popular officially supported data sources, as well as community-driven plugins.
Related Articles:
How to Install Prometheus on Ubuntu 22.04 LTS
Deploy Node.js app on Amazon ECS and Fargate
Reference:

